Articles

The Mystery of the Lost Scooby-Doo Episode: When Kareem Abdul-Jabbar Met D.B. Cooper

For decades, Scooby-Doo fans have whispered about the existence of a long-lost episode featuring a crossover with NBA legend Kareem Abdul-Jabbar. The mysterious episode is said to have explored the enigmatic case of D.B. Cooper, the unidentified man who hijacked a Boeing 727 in 1971 and vanished into thin air. Although the episode was never aired, tantalizing hints in the form of newspaper clippings and television news broadcasts from the 1970s have kept the legend alive. Now, we’ve pieced together a comprehensive account of the episode’s plot and the reasons behind its disappearance. Grab your Scooby Snacks, and let’s unravel this mystery!

Rumored Title and Plot Synopsis

Supposedly titled, “Scooby-Doo and the Skyjack Slam Dunk”, the episode begins with The Mystery Inc. gang receiving an invitation from Kareem Abdul-Jabbar to join him at his charity basketball game. Upon their arrival, they learn that Kareem has been receiving mysterious letters from someone claiming to be the infamous D.B. Cooper. The letters challenge Kareem and the gang to solve the mystery of his true identity.

The game is held in a small town near the site of Cooper’s legendary skyjacking. While exploring the area, the gang stumbles upon a long-abandoned cabin deep in the woods. Inside, they discover a trove of clues pointing to the possible identity of D.B. Cooper, including a tattered parachute and a briefcase full of cash.

As they piece together the evidence, the gang encounters a series of spooky apparitions, including a ghostly figure who seems to be D.B. Cooper himself. With Kareem’s help, Scooby and the gang unmask the “ghost” and reveal him to be a local conman trying to cash in on the legend.

In the end, the gang deduces that the real D.B. Cooper had died in the wilderness after his daring escape. Kareem thanks Mystery Inc. for their help, and they all celebrate with a sky-high slam dunk.

Why the Episode Never Aired

According to the New York Times article dated September 12, 1973, the episode was slated for release during the fall season. However, the FBI intervened, citing concerns that the episode would make light of a serious criminal case and potentially inspire copycat crimes. As a result, the episode was pulled from the schedule and locked away in the Hanna-Barbera vaults.

In addition to the New York Times article, several other sources have made passing references to the lost episode:

  1. Los Angeles Times, July 7, 1973: An article about the upcoming season of Scooby-Doo mentioned the Kareem Abdul-Jabbar crossover episode as a highlight.
  2. The Washington Post, August 27, 1973: A report on popular culture’s fascination with D.B. Cooper briefly mentioned the upcoming Scooby-Doo episode.
  3. CBS Evening News, October 10, 1973: A segment on the FBI’s involvement in television programming cited the Scooby-Doo episode as an example of government censorship.

Conclusion

While the lost episode of Scooby-Doo featuring Kareem Abdul-Jabbar and the D.B. Cooper mystery may never see the light of day, the intrigue surrounding it has only grown over the years. These tantalizing clues from the past have fueled the imaginations of fans and mystery enthusiasts alike, making “Scooby-Doo and the Skyjack Slam Dunk” one of the most enigmatic episodes in television history.

This April Fools Post was written in part by ChatGPT Pro

So, You Want to Be an Azure Synapse Spark Wizard? A Beginner’s Guide to Conjuring Data Magic

Greetings, noble data explorers! Are you ready to embark on a perilous journey into the mystical realm of Azure Synapse Spark? Fear not, for I shall be your humble guide through this enchanted land where data is transformed, and insights emerge like a phoenix from the ashes.

Azure Synapse Spark, the magical engine behind Azure Synapse Analytics, is the ultimate tool for big data processing, machine learning, and other sorcerous activities. In this enchanting blog post, I shall bestow upon you arcane knowledge that will aid you in your quest to become an Azure Synapse Spark wizard. So grab your wand (or keyboard), and let’s begin!

  1. Enter the Synapse Workspace

Before you can begin your spellcasting journey, you must first venture into the Synapse Workspace. This mystical chamber is where all your Azure Synapse Analytics resources are stored and managed. To gain entry, you’ll need an Azure account – the modern-day equivalent of a wizard’s enchanted scroll.

  1. Summon the Azure Synapse Spark Pool

Once inside the Synapse Workspace, you must summon the Azure Synapse Spark pool by navigating to the “Apache Spark pools” tab and clicking on “New.” As the portal to the magical realm opens, you’ll be asked to provide a name, size, and other mysterious properties for your Spark pool. Choose wisely, for these decisions may impact the power and performance of your spells.

  1. Conjure a Notebook

Now that you have created your Azure Synapse Spark pool, it’s time to conjure a magical notebook. These enchanted tomes will hold the spells (or code) you cast to tame the wild data beasts lurking within. To create a notebook, navigate to the “Develop” tab, click on “+” and then “Notebook.”

  1. Choose Your Wizarding Language

A wise wizard once said, “The language you choose defines the spells you can cast.” In the land of Azure Synapse Spark, you have three primary wizarding languages at your disposal: PySpark, Spark SQL, and Scala. Each language possesses unique incantations and charms, so select the one that best suits your mystical needs.

  1. Channel the Power of the Data Lake

As a budding Azure Synapse Spark wizard, you must learn to harness the raw power of the Data Lake. This vast reservoir of knowledge contains all the data you’ll need for your magical experiments. To access it, you must create a Data Lake Storage account and then link it to your Synapse Workspace. Once connected, you can import your data from the Data Lake into your enchanted notebook.

  1. Cast Your First Spell

Now, with the Data Lake’s power coursing through your veins (or notebook), you’re ready to cast your first spell. Begin by writing a simple incantation (or code) to read data from your Data Lake Storage account. As the data materializes before your very eyes, marvel at your newfound powers.

  1. Unleash the Magic of Data Transformation

With your data in hand, it’s time to weave your magic and transform it into insightful, actionable knowledge. Use your wizarding language of choice to cast spells that filter, aggregate, and manipulate the data to reveal hidden patterns and insights. Remember, practice makes perfect, and as you grow more experienced, your spells will become more potent and powerful.

  1. Share Your Wizardry with the World

A true Azure Synapse Spark wizard never hoards their magical knowledge. Instead, they share their wisdom and insights with fellow adventurers. Once you’ve conjured a captivating story from your data, export your notebook to a PDF or HTML file, and share your tale with your colleagues, friends, or the entire realm (or company). Bask in the glory of your newfound wizardry as you empower others with your illuminating discoveries.

Congratulations, intrepid data explorer! You have successfully navigated the mystical realm of Azure Synapse Spark and taken your first steps towards becoming a true data wizard. As you continue to hone your skills and delve deeper into the enchanted world of big data, machine learning, and analytics, always remember the immortal words of Albus Dumbledore, “It is our choices, [data wizards], that show what we truly are, far more than our abilities.”

So go forth, brave wizards, and let your magical Azure Synapse Spark journey be filled with curiosity, wonder, and the occasional giggle. After all, there’s nothing quite like a well-timed data pun to lighten the mood during your most intense spellcasting sessions.

This blogpost was created with help from ChatGPT Pro.

Mastering Paginated Reports in Power BI: Tips and Tricks for Success

Power BI is a powerful tool that enables users to create interactive reports and visualizations to facilitate data-driven decision making. One of the key features of Power BI is the ability to create paginated reports. These reports, also known as ‘pixel-perfect’ or ‘SQL Server Reporting Services (SSRS) reports,’ provide a high level of control over report layout and formatting, making them perfect for generating invoices, official documents, or detailed data tables that need to span multiple pages.

In this blog post, we’ll explore several tips and tricks that will help you create professional and efficient paginated reports in Power BI.

  1. Plan your report layout

Before diving into Power BI, take a moment to plan your report layout. Consider the information you need to display and how it should be presented. This will ensure a more efficient design process and will help you avoid making unnecessary changes later on.

  1. Use Power BI Report Builder

To create paginated reports, you’ll need to use Power BI Report Builder. This standalone desktop application is specifically designed for creating paginated reports and provides a familiar SSRS environment. You can download the Power BI Report Builder from the Power BI website.

  1. Set up data sources and datasets

Once you’ve opened Power BI Report Builder, you’ll need to set up data sources and datasets. To do this, go to the “Report Data” window, right-click “Data Sources,” and click “Add Data Source.” After connecting to your data source, create a dataset by right-clicking “Datasets” and selecting “Add Dataset.” This process will allow you to access the data in your report.

  1. Use tables, matrices, and lists wisely

Paginated reports offer a variety of data regions, including tables, matrices, and lists. Each data region has its own unique capabilities:

  • Tables: Use tables for displaying data in a simple row and column format.
  • Matrices: Use matrices to show aggregate data, especially when you need to display row and column groupings.
  • Lists: Use lists to create free-form reports with varying data layouts.

Choose the appropriate data region based on your report’s requirements to ensure an efficient and organized layout.

  1. Leverage expressions for dynamic content

Expressions are a powerful way to create dynamic content in your paginated reports. You can use expressions to:

  • Concatenate fields
  • Format dates and numbers
  • Calculate totals and averages
  • Implement conditional formatting

Learn the basics of expression syntax and familiarize yourself with the available functions to unlock the full potential of your paginated reports.

  1. Utilize headers and footers

Headers and footers are essential for adding context and professionalism to your reports. Use them to display important information such as page numbers, report titles, and company logos. Headers and footers can also contain dynamic content using expressions, making them even more versatile.

  1. Manage page breaks and pagination

Controlling page breaks and pagination is crucial for ensuring a clean and well-organized report. Use the “Page Break” property in the properties window to control the placement of page breaks within your report. Additionally, you can use the “PrintOnFirstPage” and “PrintOnLastPage” properties to control the visibility of report items on the first and last pages.

  1. Preview and test your report

Always preview and test your report to ensure that it meets your requirements and displays correctly. This will help you identify any issues or discrepancies early in the design process, saving you time and effort in the long run.

Conclusion

Creating paginated reports in Power BI can be a rewarding experience when armed with the right knowledge and tools. By following the tips and tricks outlined in this blog post, you’ll be well on your way to mastering paginated reports and creating professional, efficient, and visually appealing documents. Remember to plan your layout, use the appropriate data regions, leverage expressions, and test your report thoroughly. By doing so, you’ll not only impress your colleagues and clients with your Power BI skills but also make data-driven decision-making more accessible and efficient for your organization. So, go ahead and unlock the full potential of Power BI paginated reports, and take your reporting capabilities to the next level!

This blogpost was generated by ChatGPT Pro as an experiment to see the level of quality it would generate.

Related reading

Be sure to check out my YouTube channel!

I know it’s been quite some time since I’ve posted on here, and while I hope to start to post more regularly here, you can always find me posting regularly on my YouTube channel. And by regularly I mean “More than once a year” :).

It’s focused on Power BI and paginated reports, along with some other neat items I’ll sometimes focus on (like Premium per user!).

Make sure you check it out if you haven’t had the chance to do so – Chris Finlan’s YouTube channel

Thanks for reading everyone!

Happy birthday, Paginated Report Bear!

20190606_022241354_iOSpadgie

Paginated Report Bear turns 1 year old today.  He wasn’t expected to last more than a few weeks.

20190405_043319215_iOS

For those of you who aren’t familiar with Paginated Report Bear, my friend Chris Webb described him as follows – “Well, he’s the breakout social media star of 2019, a furry YouTube sensation whose incisive interviews of members of the Power BI development team have become renowned for their deep technical content and insights into the Power BI roadmap. If you’re not watching his videos on YouTube, you’re missing out.”

20190609_152624000_iOS

If you watch the very first video that “Padgie” did 1 year ago today, Chris’s description seems EXTREMELY generous.  The production quality was very low, and Mr. Matthew (my son) couldn’t even say “Paginated Reports”.  Why even do videos with a bear in the first place?  You see, my son had for some time wanted to do a YouTube video series with me where his stuffed animals would be included.  They had been granted various personalities and voices throughout the years by yours truly, and these characteristics have carried over to the videos.  I decided to rename “Mickey” to “Paginated Report Bear” because he was the lovable but dumb one, and I thought the name sounded ridiculous.  And since my (naïve) assumption was we’d do a few of these videos during my vacation, and my son would get tired of doing them, that would be that.  And that almost happened – there wasn’t any videos for a month from December to January, and I figured that was the end of it.

20181127_162925342_iOS20190722_160008289_iOS

Then something strange happened – not only did my son want to do more, but some members of the Power BI community seemed to actually ENJOY the videos.  He was featured on Guy in a Cube, he was mentioned on the BiFocal podcast, and he was a hit at the MVP Conference in March (he even got an MVP pin!).  It was then that we decided to have him start interviewing members of the product team, starting with Lukasz back in April, and the rest is history.

20190609_212520198_iOS20190610_141332035_iOS

But the biggest achievement of Paginated Report Bear is the one he’s taught my kids as they’ve watched their dad carry a cheap stuffed bear purchased from EBay to conferences across the country just so people can take a selfie with him – you can do something different, or be different, and be successful in your career and in life.  That means a lot, and shows the broad Power BI community can have an impact outside of the day to day product details.

20190610_122939172_iOS20190610_194931190_iOS

So thank you, and I look forward to what the future has in store for Paginated Report Bear in the year ahead!

20190612_024209056_iOS20190703_173803591_iOS

Free sample Power BI paginated report – Ultimate Export Report available for download

I recently came across an interesting article on MSSQLTips for SQL Server Reporting Services that showed how you could use a T-SQL query as the parameter value, and have it return a table of data as the result set from that query.  (The original article is here, and I will fully admit that all I did was take this author’s idea (and that of one of the commenters) and stick it into this sample report  – https://www.mssqltips.com/sqlservertip/5757/create-dynamic-ssrs-reports-using-a-query-as-an-input-parameter/ ). I wanted to see if this worked for Paginated Reports in Power BI, and of course it does!  So once I put in my connection string information for my Azure SQL database (the original article was against a traditional SQL Server database), I can write just about any select query against that database as a parameter at runtime and get back results in a nice table that can be exported out to Microsoft Excel.  I created a short video to show you how it works in practice –

Now there’s little chance I’d use this report as is in production – it’s really just a way for me to test some things, dump out data quickly, and it demos nicely.  But there are some ways you could potentially change this to make it more production friendly – have a list of dropdown values that represent the queries that you update on an ongoing basis, or even allow users to submit queries through a workflow you approve that updates the parameter list.

If you’d like to try it out yourself, feel free to download the sample report –

Ultimate Export Report

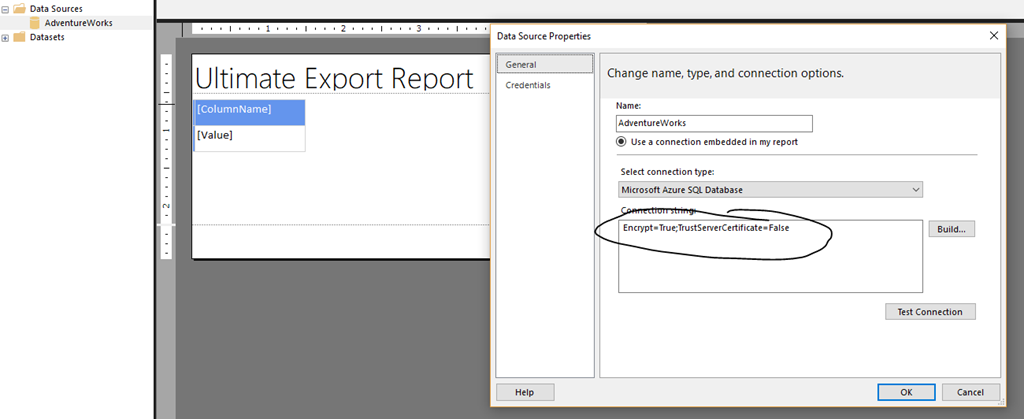
Once downloaded, you’ll need to update the data source with your connection string to whatever database you’ll use this against in Power BI Report Builder before you can use it in the service, but once you do that, you should be good to go.

image

Thanks for reading!