Drillthrough from one Datazen Map Dashboard to another dynamically

Tonight’s post came out of a conversation I had with my friend Chris here at Microsoft (yes, we’re both Chris).  I was looking to see if I could drillthrough from a map of the United States into each individual state, and see the county-level information of another Datazen dashboard.  The answer is – yes, kindof!

Why the caveat?  Because I want to dynamically have the state change based on which one I select for drillthrough.  You can’t do that by drilling from one dashboard to another inside the Datazen app.  But you can do it by using the web viewer functionality in Datazen for your lower level dashboard.  Let me show you what I did.

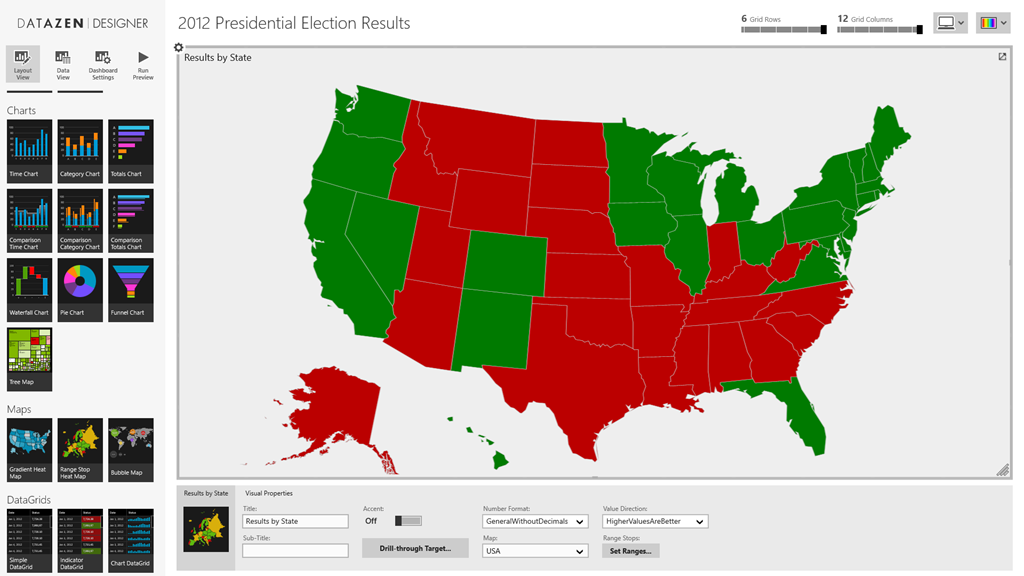
First, in the Datazen Designer, I dragged a single Range Stop Heat Map onto the canvas and renamed it accordingly.
DatazenMap

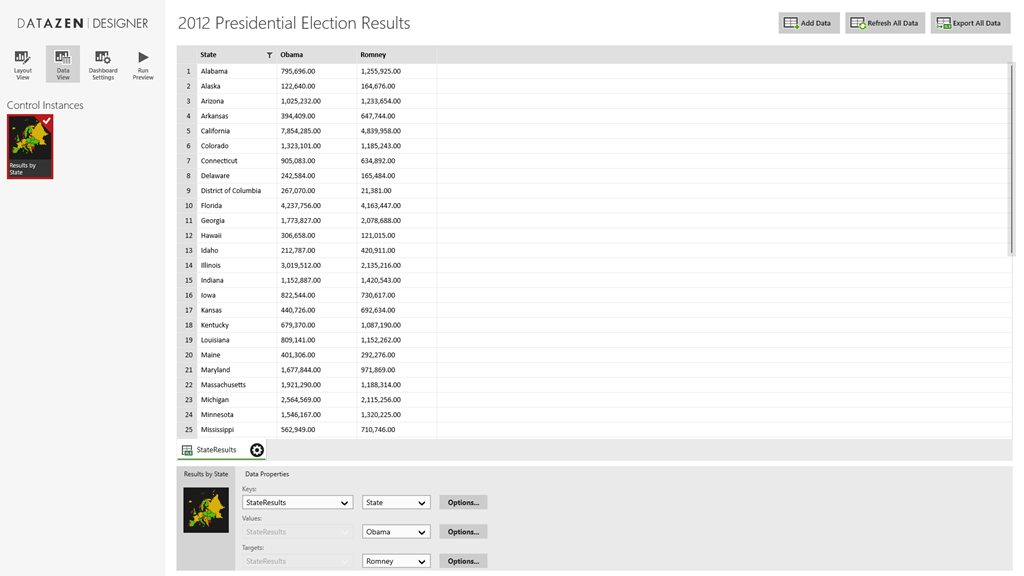
Next, I used Power Query in Excel to search online and find the state by state results for the 2012 Presidential Election.  I brought the results into an Excel file, and loaded the file into my Datazen dashboard under the “Data View” tab by choosing “Add Data” and “Local Excel File”.
Screenshot (27)
I made “Obama” the Values selection and “Romney” the Targets selection.  It doesn’t really matter which one you choose for which for this example, however.  Then I flipped back to my layout view.

I changed the range stop values to show a very narrow range for Neutral Start/Neutral End (99.98 and 99.99), so unless you had another Florida situation, you’d only see two colors for our map.  At this point, I saved it and created a new map dashboard.  But instead of using the out of the box maps, I loaded a new custom map from my local hard drive by choosing “Custom Map From File” from my map selection list.  Here I loaded the Pennsylvania map files I had (here they are if you would like to use them.  Just save them locally and extract them to somewhere on your machine – http://1drv.ms/1H1PtLp).

Screenshot (28)

Then I created a new map dashboard, doing all the same setup items I did for the map of the US.  I called it “Pennsylvania” and published it to my Datazen server.

I want everyone to see this dashboard, so I need to make it public, which is something that Datazen server supports.  To do that, I need to add a guest account to my Datazen server, and then give it rights to that dashboard.  So I add a guest Server User, like so –

image  Then I add Ol’ Guesty to my hub as a user –

image

Then I make sure I assign Sir Guest-A-Lot to my public dashboard (as you can tell, I’m kinda punchy right now).

image

Now I can link directly to this dashboard by using the following pattern as described in the Datazen documentation – http://local.server/viewer/public/dashboard?name=DashboardName. 

With that complete, I can go back to my original map dashboard and set up the drillthrough to the url of this state dashboard.  Since I want it to drillthrough to the selected state, and not just Pennsylvania, I’ll use the parameter value so my url looks like this –

http://sample.cloudapp.net/viewer/public/dashboard?name={{ RangeStopHeatMap3.SelectedItem }}

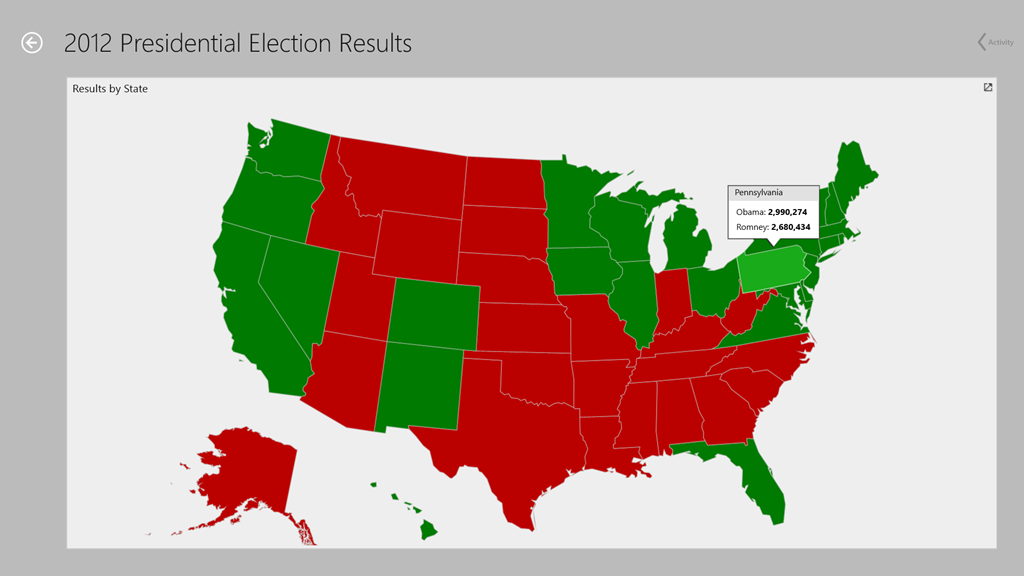
Now I publish my dashboard, and when I click on the state of Pennsylvania:
Screenshot (29)

A web browser opens up and I get this!
image

So yeah, there’s obviously the drawback I need to do this 50 times in this example.  But it DOES work (kindof), just like Chris and I discussed.

Thanks for reading!

How to use an Excel data source for KPI’s in Datazen

Happy weekend, folks.  As mentioned in the guest post I did with Rob Collie, a folder of Excel files can be used as a data source for dashboards with Datazen.  However, when it comes to KPI’s, there isn’t out of the box support to use Excel as a data source for those.  But you can still use Excel if you setup a custom data connector to do so.  One caveat with this approach – what’s we’re basically doing is allowing Datazen Server to use Excel like it would a normal SQL Server data source.  This means you’ll need to write at least some basic T-SQL statements to actually bring back data from your Excel workbook.

Assuming you know how to do that, here are the steps you need to follow to enable this –

1. You need to download and install the Microsoft Access Database Engine 2010 Redistributable (choose the AccessDatabaseEngine_x64.exe option) on your Datazen server.

2. Create a new folder named OLEDB in the following location (this assumes you setup a custom data provider with my previous post.  If you haven’t, do that first.) –

C:\Program Files\Datazen Enterprise Server\service\dataproviderschemas

image

3. Download the following file – Excel.zip and extract the XML file to the folder you just created.

image

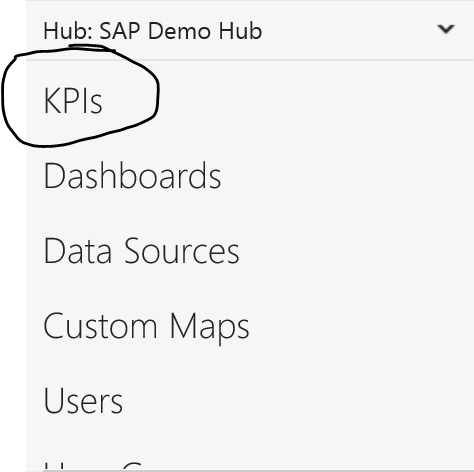
4.  Now login to your Datazen Control Panel and go to “KPIs” for the hub you want to setup with your KPIs.

image

5.  Click “Create New Group”

image

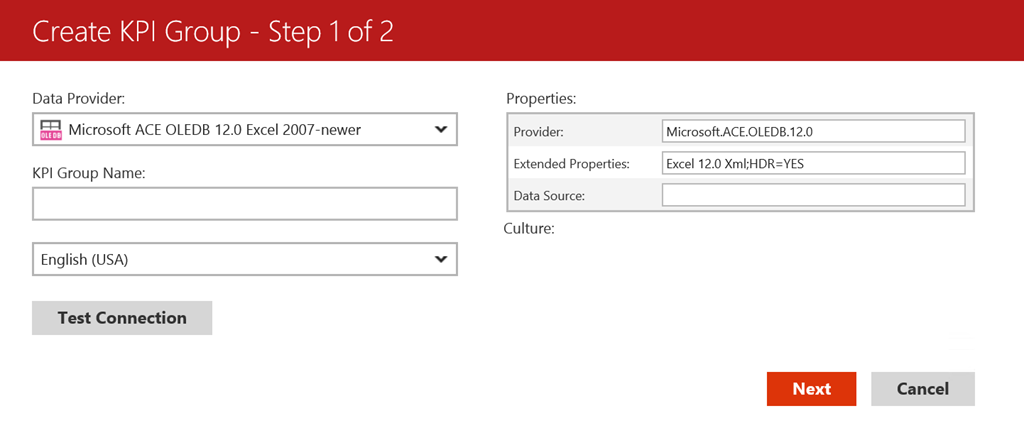
6.  You should see the new provider you setup in the previous steps listed as “Microsoft ACE OLEDB 12.0 Excel 2007-Newer” –

image

Enter a name for your KPI group, and leave the HDR=Yes item under Extended Properties if your Excel file contains a header row.  Otherwise, change it to “No”.

image

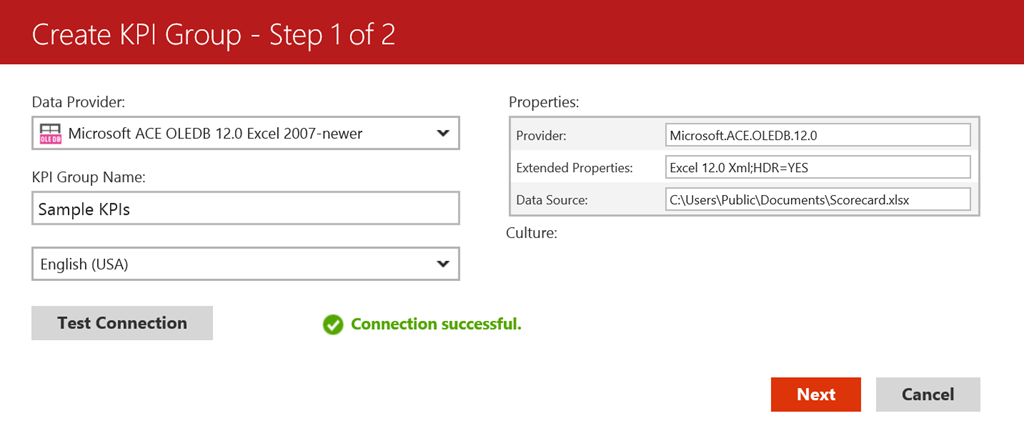
Next, in the data source area, put the file path of the Excel document you wish to you use.  Make sure it is some place the Datazen service account has access to.  Test the connection to make sure it works, and hit next if you see the “Connection Successful” message –

image

Select the groups who should have access to the data source, then hit Finish.  This will bring you back to the KPI menu with your new KPI hub showing –

image

If I click “Create New KPI”, I’m presented with the KPI Creation screen.  On the right hand side of the screen, I see my KPI Value/Goal/Status fields I can use my Excel data source for.

image

If I select the dropdown for “Value”, I can choose “Execute Query” and a “Define Query” link appears.  I need to click it to write my query –

image

Now I can write my query for this KPI Value.  The table name equates to the name of the tab in the Excel file, but you need to have a ‘$’ appended to it.  A sample query would look like this –

image

If successful, it should bring back a single result to be used with that KPI –

image

Hit ‘Update’ to save your query and return to the KPI setup screen.  You can now repeat the process for the Goal/Status/Trend Set items if you wish, or you may set any or all of those manually. 

If you want to learn more about KPI’s and how to set them up in Datazen, refer to the Datazen documentation.  Hope this was helpful, and enjoy the rest of your weekend!