Providing context for the shadow – Part 2 of the Powerful Productivity Series

This next scenario was one I was going to tackle at some point, but I decided to do it now because of a couple articles I read this past week.  Interestingly enough, one of the articles was a blog post from Tableau, and the other was a survey done by Domo.  I found them interesting because they both touched on a topic I’ve been intimately involved with for the last several years, and that’s sales reporting.  I’m guessing, however, my reaction to each article was different than other folks who read them because of that.

The Tableau post told the same story that every company that sells a BI solution talks about to their customers – here’s how we use our own product to run our business.  For example, Marc Reguera does a great job telling customers how the finance team at Microsoft uses the Microsoft stack to run the business.  I’d have been shocked if the article was about how the sales teams at Tableau reported on their business using Power BI (although I’m guessing James Phillips would have blogged about that article as opposed to me.  But I digress).  The report they showed had the usual metrics you see every sales organization look at – top opportunities in the pipeline for the quarter, YoY growth rates, Achievement vs. Quota, etc.  There was nothing “wrong” with the post at all – but my first reaction was immediate and made me laugh.  That was because I created a report similar to this four years ago for a VP I supported at the time.  I’d spent months doing the following –

– Getting security access to the right data

– Ordering a VM to host my reports

– Setting up SQL Server on the VM to host my data from these sources

– Creating SSIS jobs to cleanup and bring the data in from various .csv files

– Setting up SQL Server Reporting Services

– Building the report in Report Builder

– Deploying the report

There was no doubt in my mind I was about to be the new BI hero in town.  I presented the report to him and waited for his reaction.  Which was the following –

shrug1

Shrug re-enactment drawing courtesy of Rob Collie

Yep, that was his reaction.

“You don’t like the report?” I asked.

His response and subsequent explanation really stuck with me.  And it was partially highlighted in the survey results I called out earlier – on slide 17, some specific issues were culled from the responses.  The ones I noticed right away were these –

– inaccurate

– not up to date

– unreliable

– hard to understand

When it comes to sales reporting, the vast majority of data comes out of the Customer Relationship Management, or CRM, system.  This is where the sales organization enters all of the information around their customers and the sales opportunities they have with them.  You might have heard of some of the companies that sell CRM systems – Microsoft, Salesforce, and SAP are three of the largest vendors.  However, every CRM system has the same “flaw” – they all rely on salespeople to enter data in the system.  And the quality of the information entered can vary wildly depending on the salesperson for a number of reasons.    

This isn’t meant to be an blanket indictment of folks working in sales.  Being a good salesperson is HARD.  Having a quota you are responsible for, presenting or speaking to customers most days, making cold calls or traveling – it is a job that comes with a lot of pressure.  And every time you enter something into CRM, it’s going to be immediately tracked, dissected, discussed by your manager, their manager, etc.  Which means sometimes, people are very “selective” about what they put in CRM – some might think to themselves, why bring a lot of extra attention to yourself if you don’t have to?  Or they’ll put the value of the opportunity much lower than it really is for similar reasons.  Because of travel, perhaps they don’t update their data in the system for a few days because their too busy.  Or they hate entering stuff in CRM and put it off as long as possible.  Or they are told to put a bunch of opportunities in the system that they have little confidence in but need to show a “full pipeline” for management.  Combine this with the usual number of data entry errors folks will make, and you have a scenario where you have a sexy dashboard that is showing a pretty picture of a lot of bad data.

Should these folks be doing these things?  Of course not.  But the point my manager made was that since this did happen, he needed a solution that could account for this “shadow pipeline” as well as what came out of CRM so he could make a proper forecast of where the quarter would end up.  And he wanted it structured the way they had it currently in Excel, which looked like similar to this overly simplistic re-creation –

image

Why couldn’t he just force his team do it properly in CRM, you might ask?  Because they were a global team that worked with the regional sales folks, but didn’t directly enter any of the data.  This is hardly unusual – most, if not all, customers I talked to had many, many groups leveraging this data that weren’t entering it directly.  So they needed a way to include this information in the report.

At first glance, this seemed like an easy enough request to add.  I’d follow a similar pattern to what I did in the first post in this series and build a form where his direct reports could enter their shadow pipe, then show it in the format he wanted in the SQL Server Reporting Services report I’d built.  So I went back and did that (which took several hours of work) and re-presented it to him.  Again with the shrug.

“What’s the problem now?” I asked.

“I can’t change the shadow pipe values,” he said.  “I need to be able to do that on the call.”  He was referring to the regular team call this report was used on.

“Well, I can show you how to change them, but I don’t understand.  Why do you want to change values on the call they just typed in for that call the day before?”

In hindsight, this was a really stupid question.  He could have said, “Because I said so, dumbass.”  But he decided to explain anyways.

“There could be a number of reasons.  First off, a lot of stuff can happen around here in a day, so there could be an update that needs to be reflected.  Second, I just hired three new people.  They don’t know the accounts real well and might change their forecast when we talk about it.  Third . . . ”

“Okay, I get it.  But you can change the values – just open the app I built, change the dropdowns, find the value to change, hit save, re . . .”

That was not what he wanted to hear.

“I’m not doing all that, Chris.  I want to change it like I do now, where it takes a second and all the calculations update automatically.  And I also want a way where I can add notes on the call that I can use when I share this information up the chain.  You should never give an executive a sales report without context.  Otherwise you’re just creating a bunch of additional work.  They’ll always want to know why the numbers are what they are, what are we doing to help the teams drive more revenue, do we need to re-allocate funds around . . .”

He was absolutely right – I’d seen that scenario play out time after time.  So I went back and took another crack at it using Excel and this new add-in Microsoft had released called Power Pivot.  However, the way the data needed to be laid out meant people would have to enter data in “holes” in the middle of a pivot table.  There were also a bunch of subtotals in the report currently where I needed to add up data from both the entered data in Excel and the summarized data from SQL Server that also sat in locations in the current report I couldn’t see how to do in Excel.  It also didn’t address the issue of having a central place for folks to go and enter the data because we didn’t have SharePoint setup (this project spurred me to do this for the team on my own, actually).

Eventually, the solution I provided him was a completely custom solution in Visual Studio that took probably three weeks to build, and countless additional hours to tweak over the time I was supporting them using it.  The good news was, he was happy with this and it led to a number of great projects I worked with them on.  The bad news was, making changes was something only I could do, so it died as soon as I left and they needed to make a change. Plus, I never felt comfortable I’d found the best solution.

What if I had the opportunity to do it over again now?  Well, I’m not waiting any longer – let’s redo this baby right now using Office 365 and Power BI and what we can come up with.

I’m going to run through the entire scenario in my head as best as I remember how this used to work, and map it to the functionality in Office 365 or Power BI in each step –

– A meeting invite was created and sent to the participants via e-mail (Outlook and Exchange)

– Data needed to be cleaned up and combined from CRM and another data source that has the quarterly sales targets stored (Power Pivot/Power Query in Excel 2013).

– As opposed to building a custom app, I’ll create the report using Excel as the front-end and taking advantage of Cube Formulas.

If I had simply spent more time reading Rob Collie’s blog post from January 2010 (!), I would have seen I could have provided my manager with the exact functionality he was looking for by leveraging cube formulas.  For the people who’ve never used them before, in essence you have the ability in Excel to blow up a pivot table and layout the cells however you want while still being linked to the data model dynamically.  Rob spends more time talking about cube formulas than I do about Datazen (well, close anyways), so I’d strongly urge you to read his blog to learn more, but here’s how I’d do it for this project –

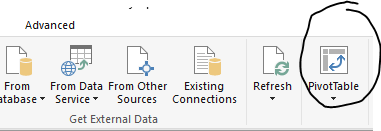
1. From the Power Pivot window in my Excel 2013/2016 Preview workbook, I’ll create a new PivotTable (or I could create it on the Insert tab in Excel.  It doesn’t matter) –
image

2. Add to the pivot table the results I need for my report from the CRM system.  I added a slicer as well just to make sure everything is still connected to the live data source after I convert the data –

image

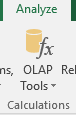
3. Under PivotTable tools, select OLAP Tools, and Convert to Formulas in the dropdown  –
image

You’ll see this has converted the cells to individual formulas in the formula bar that looks something like this, depending on which cell you have highlighted –
image

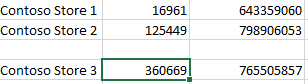
4.  Cut and paste the last row of values down one from it’s current location so your report looks like this –
image

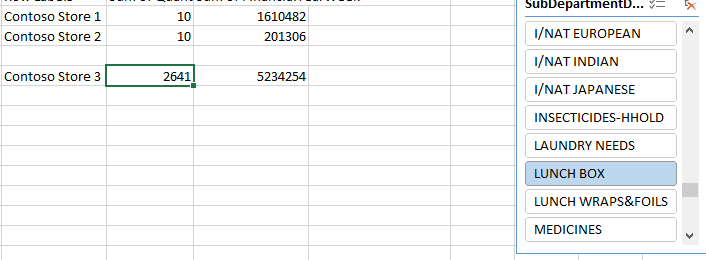
5.  If I click the slicer, my values update to the proper results
image

I now can lay out the report any way I need to, allowing data entry in certain fields, add formulas that properly sum the fields that are entered and tied to the data source, add an area for comments to be entered for each row, etc.  It would have met the requirements he had for his frontend experience.  Single tear . . .

– Central place to collect shadow pipeline and notes from users for the report (OneDrive for Business Access Web App)

As I thought about how I’d handle this piece, I initially considered the idea of just saving my report to OneDrive for Business, sharing a link with the users and allowing them to enter the data in the shadow pipeline field accordingly since the report was small enough it could be used with Excel Online.  He could simply overwrite that on the call with them, or add additional notes and call it a day. There were a couple issues there I had concerns about –

1. Anyone could potentially overwrite the fields that contained cube formulas when editing in the browser.  It wouldn’t be the end of the world, since I’d have multiple backups of the report, but still wouldn’t be ideal.

2. Instead, I looked at adding protection to the sheet while leaving certain cells unlocked and available for editing.  Problem was, this only would work when folks opened it in Excel locally.

For the record, if I had offered this second idea to my manager on how to handle this, he would have said that was fine and not to overthink it.  I know this because we ended up doing something similar for a different project once I got SharePoint stood up.

A better answer in my mind would be to let his team enter the value and notes via an Access app in Office 365 like I showed in the last post, but give him a field where he could enter a value as well, and supersede any entry folks made in the calculations if he entered a value.  Why bother doing this extra work if I know he would have accepted the previous option as a solution?  Because I know he’ll want to capture these values in a way that he could see historically what people were forecasting and how accurate they were vs. the actual sales amount (I know because he did ask for it later on, by the way).  My proposed solution would allow him to do just that, and then he’s the only one ever updating data directly in the report.

– Share the report with my manager and his team (OneDrive for Business and Power BI)

By loading the report to OneDrive for Business and then accessing it through Power BI, I get the best of both worlds.  I now have a way to share a link to the Excel document with my manager so he could view and edit it, provide a link to anyone else so they can view it only, and leverage the Power BI personal gateway to refresh the data on a schedule basis.

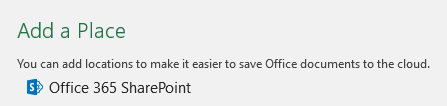
This is pretty easy to do.  I can save the file right to OneDrive for Business from Excel directly.  I just go to File –> Save As, then add an Office 365 SharePoint location
image

Enter my credentials and my OneDrive for Business information is added.

image

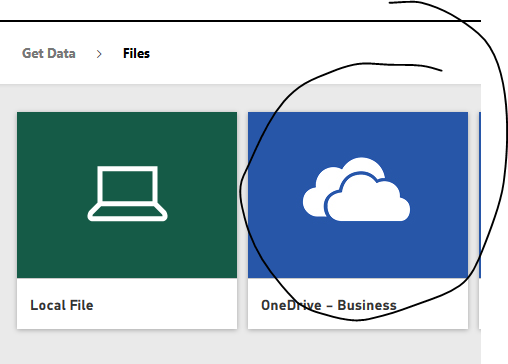
Once I save it there, I flip to my Power BI area and add data from my OneDrive for Business folder
image

then choose my Excel file I want to connect to.  I want to see and use the file just like I would in Excel Online, so I choose that

image

Then I can view or edit it as an Excel document AND leverage scheduled refresh.  No conversion to a new Power BI report necessary.

image

– Run the online meeting for the global team where they review the report and talk about their part of the business (Skype for Business)

There, I was able to redo everything using Power BI and Office 365 and meet his specific requests asks around being able to provide context for the shadow pipeline figures that were captured as part of this process.  I wonder if I could connect the data in that Excel sheet to the PowerPoint presentation he wants to give at the end of each quarter.  I bet I can . . .

Hmm – I’ll save that for another post in this series down the line.  So remember, the next time you’re asked to build a sales dashboard or report, see if can you provide context to the shadow with it.  Because if your solution doesn’t have that level of flexibility, people looking at your report might be “in the dark” when it comes to having the right answers (Yes!  I was looking for a terrible pun to end this post with, and I succeeded.  In your face, good storytellers.)

Until next time!

Powerful Productivity using Power BI and Office 365 – Part 1 in a series

Alright the long weekend is here (and sadly over by the time I finished this post)!  And since Monday is was a celebration of the worker here in the US and Canada, I wanted to do something special for this post.  Microsoft Office is the go to productivity suite for 1.2 billion people every day.  That translates to 1 in 7 people on the planet earth using Office to get things done, both personally and professionally.

It’s also a key part of every successful business intelligence implementation I’ve seen – and I’m not just talking about the ability to export to Excel.  In my previous life in shadow IT, the VP I supported used to hammer this point home to me.  He and his team lived in the Office suite day in and day out to do their jobs, so whatever I was providing to his team, I needed to always keep that in mind.  They had jobs to do that didn’t involve learning a complicated new report or app – if it wasn’t easy to adopt, show immediate value, and work well with things like PowerPoint, Excel and Outlook, then it was dead on arrival.

While I’d like to think I did this pretty well, looking back now, I can’t believe how much additional work I had to do simply to achieve the same results I could get just a few years later.  And I’m not talking about me being more skilled (or balder) – the level of productivity someone can achieve using tools like Office365 and Power BI is STUNNING.

You’re probably thinking – “Yeah, it’s “stunning” a Microsoft employee is telling us how amazing their new stuff is,” as you roll your eyes and switch to Jen Underwood or Rob Collie’s blog.  I’ll admit, that isn’t a terrible idea, but hear me out.  I just want to see what my old job would have been and how much more I could have accomplished.  I used to spend my days building apps, setting up databases, building reports, etc.  With the way things have been automated and simplified in Office 365 and Power BI, could they be done now entirely using those tools?

“OH MY GOD – HE’S NOT BLOGGING ABOUT DATAZEN!  THE PRODUCT MUST BE DEAD, etc.” – Thought by at least one person reading this blog post.

To this person I say, yeah, um, no.  No, the reason I am not including Datazen is because one of the rules I need to follow for this self-imposed challenge is that I can’t use IT to setup a VM for me.  I have to do everything in the context of Office 365 and Power BI for this particular challenge.

So, without further adieu, here’s a typical project request I might have gotten 5-6 years ago –

There’s a request in my inbox from someone whose team needs a line of business app built.  They need a simple app built to capture ten fields of data for a one-off project.  A couple temps will be entering the data for a week or two, and they’ll need to do it via a web interface.  There are some reports I’ll need to build off of the data, and I’ll need to show the final numbers in PowerPoint deck I provide back to them so they can add some additional commentary.

Requests like this I used to eat for breakfast (along with Honey Nut Cheerios, usually).  Let’s assume this was asked of me in 2009.  I probably completed the request this way (FYI – SharePoint wasn’t set up and available to me) –

– Ordered a virtual machine (VM) from IT then waited until it was finally provisioned for me.
– Installed SQL Server 2005/2008 on the VM to host the database
– Setup Internet Information Services (IIS) on the VM to host the website
– Built the app using ASP.Net maker (which I had purchased myself) to do these little forms over database projects.
– Deploy the app to the server from my local machine
– Built a couple reports for them in SQL Server Reporting Services using Report Builder.
– Used SnagIt to grab screenshots of the reports and app I could use in the PowerPoint deck.
– Shared the files via e-mail to the folks for them to add commentary and present out.

I can’t believe that’s really how I used to do a project like that then.  At least in 2011 I could have used Visual Studio LightSwitch and Power Pivot.  Let’s try redoing that in Office 365 and Power BI –

1.  Starting with Office 2013, Microsoft Access can be used to make line-of-business apps that you deploy to Office365 sites.  These can be accessed via the web by users to enter data that’s saved in a SQL Azure database that Microsoft provides (as long as you have no more than 1 GB of stored data).

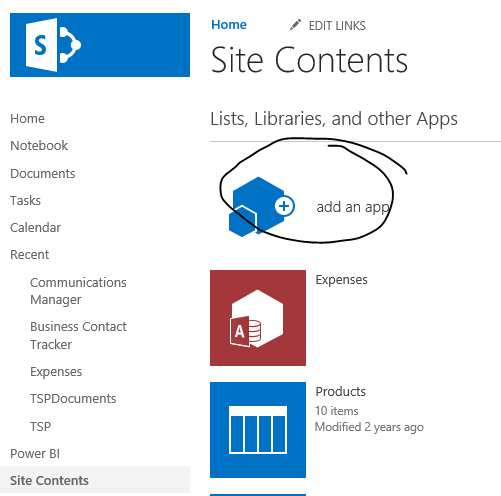
So I can open my team site in Office 365 and select Site Contents –
image

Then I choose Access App, and enter the title of the app I want to build.
image
I’m then greeted with a webpage that says I’ve successfully created the app.  I can start adding tables and screens in Microsoft Access on my desktop to finish the application.
image
About 7 minutes later (no seriously, I timed it), I have created my table and form, and it is now available online, via browser, for folks to start entering data –
image
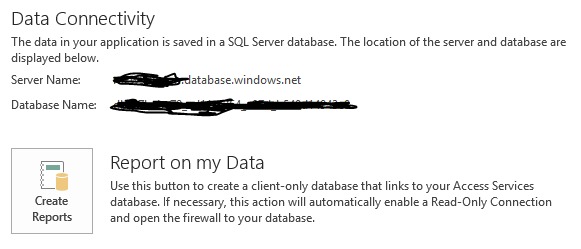
I also need to run reports.  No problem there, since if I look back in Microsoft Access on the Info tab, I am provided information around how I can connect to my database and run reports –
image
Once I’ve created the read-only connection, I can open Power BI and use the direct connect with SQL Azure functionality to connect to the database and create my dashboards and reports.  To get my connection information, I grab the details from Access for the read-only connection –
image
and then plug it into Power BI –
image
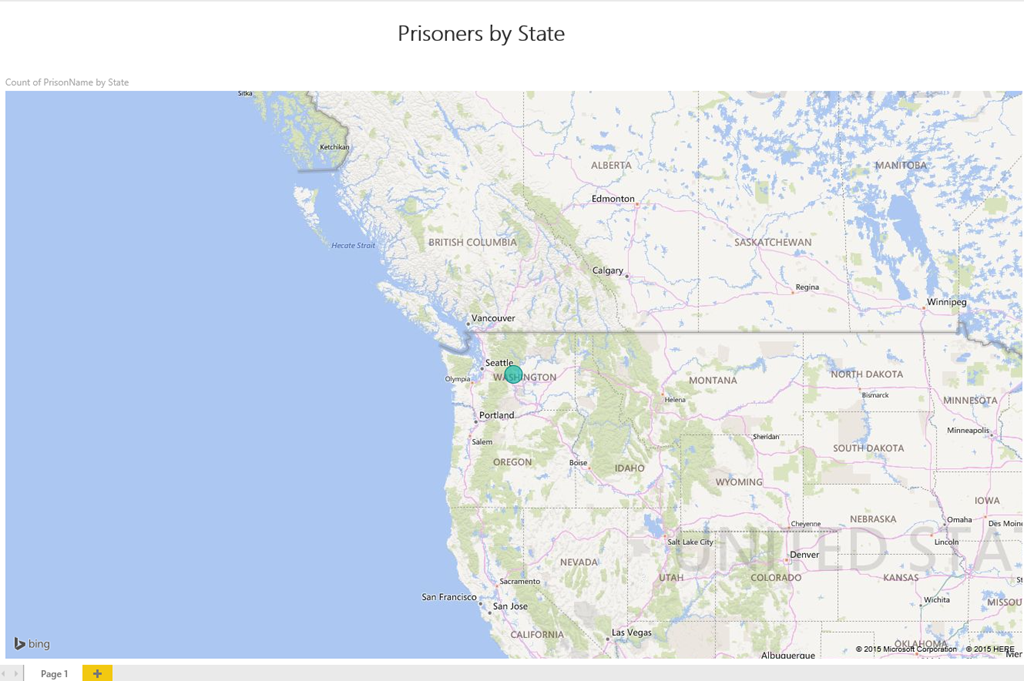
This allows me to create a report in a web browser against the dataset immediately and share it out with individuals or a group.
image
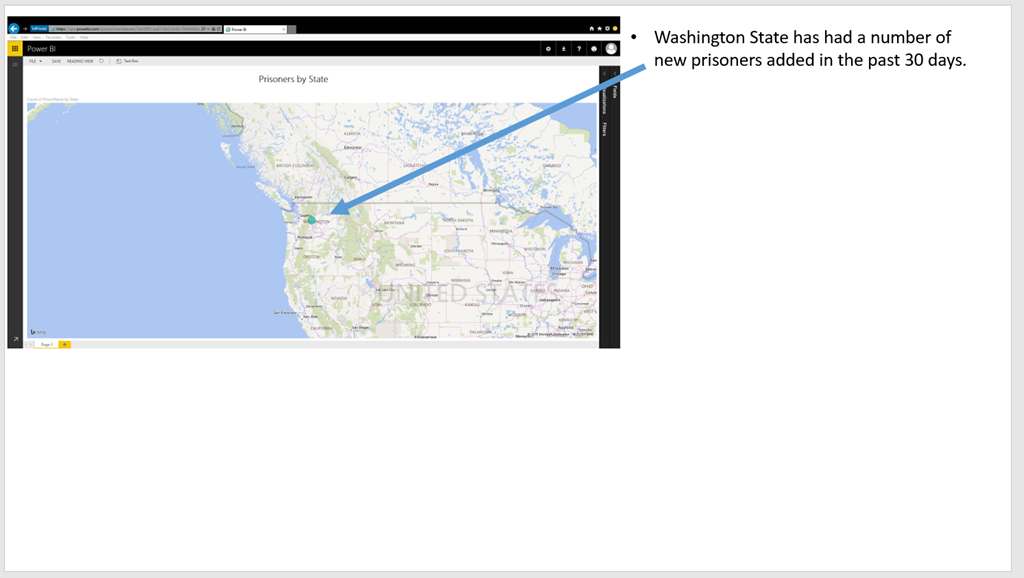
Now I can add the report to a PowerPoint slide by using some newish, built-in PowerPoint functionality (remember, I can’t use the default Snipping Tool in Windows because it isn’t in Office 365).

In Office 2013 and Office 2016 Preview, under the insert tab, I can insert a screenshot right from PowerPoint.

image

If I select Screenshot, I see all the open windows on my desktop, and I can simply select the Power BI browser window that’s open to insert the screenshot.  I then resize my screenshot so they can add commentary to the slide accordingly.image
Once I’m finished my deck, I can save my PowerPoint deck either directly to an Office 365 site, or my personal OneDrive for Business site and share the file securely via a link in my web browser to approved users only.
image

Once folks get the link I send via Outlook and Exchange, they can review the deck together if they  wanted and even make the changes in real time.

So I was able to meet the goal of only using Office 365 and Power BI to complete the project.  How much more productive was I?  The amount of time I estimate it would have taken me to complete the project previously was –

– Minimum 2 weeks (336 hours) for a VM to be provisioned for this project.
– 2 hours to setup SQL server
– 1 hour to setup IIS
– 3 hours to build and test the app
– 2 hours to deploy the app to IIS and test (this never worked right away)
– 2 hours to build and test the Reporting Services reports
– 1 hours to build the slide deck and send via e-mail

So 348 hours minimum were needed to get everything done on my side, and this is assuredly being generous with the estimate.  How long did the same thing take using Office 365 and Power BI?

– 0 hours for VM setup (not required)
– 20 minutes to build, test and deploy app
– 0 hours to setup IIS
– 0 hours to setup SQL server
– 20 minutes to build report in Power BI
– 1 hours to build the slide deck and share the link for review

So I went from needing 348 hours to needing about 2 (let’s round up).  That’s a productivity improvement of over 150x!  Just think about that – this project went from something I had to do a fair amount of additional work around just to request the VM, do all the setup and configuration, etc. to something I could have back to them for the initial data entry piece within an hour of the original request.  Plus, the entire project can be done or reported on from every mobile device.  Yeah, that wasn’t a requirement for the project originally, but it certainly would be now, and that’s all included with no additional development work required on my part.

I really enjoyed doing this first post in this series – it’s easy to forget just how powerful the tools like Office 365 and Power BI are (I know I often take this stuff for granted) and how much value they bring to our customers.    I’ll do more of these now and again that I sprinkle in between my normal Datazen posts, which I know my dozens of loyal readers eagerly await each week.

Thanks for reading!

How to insert a live Datazen dashboard into a PowerPoint slide

image

This is one of these posts where I’m reverting to my old “Radar O’Reilly” mode of having to simply figure out a way to get something done, by hook or crook.  That was often the missive I was given from the business – didn’t care how I got it done, just needed it done, as long as it wouldn’t get anyone arrested.  So with that in mind, I wanted to see if there was a simple way I could enable this (without getting arrested).

What made the most sense to me was to insert a web page into a PowerPoint slide and take advantage of Datazen’s public access support.  Since PowerPoint doesn’t support embedding a web page out of the box, I was going to install an add-in called LiveWeb, which allows you to do just that.  However, and this is important, Microsoft doesn’t recommend you do this for security reasons.  Microsoft gives you a workaround for this, but let’s see if we can’t find a better way (since I’m not looking to provide advice counter to that of my employer).

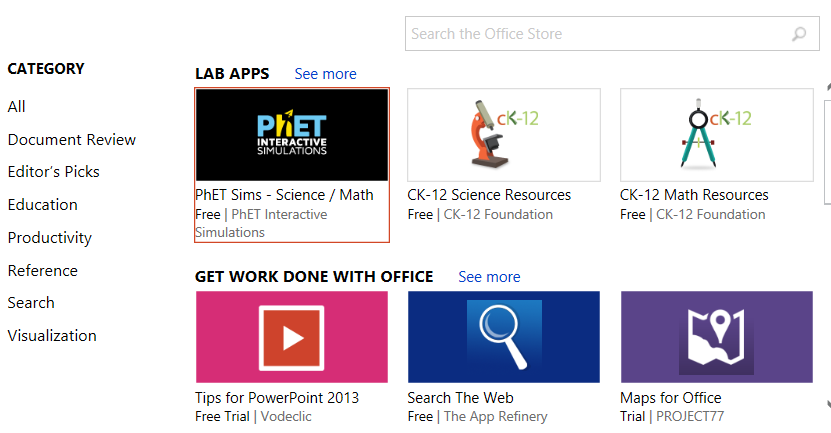
My next thought was – why not check the Office Apps Store to see if we have an official add-in?  If you haven’t used the Office App Store before, it’s an easy way to find apps, both free and paid, for your Office365 programs to use as add-ins.  To start using them in your next presentation –

1.  Go to the Insert Tab in PowerPoint.  You should see the Store Add-In in the ribbon.  Click it to open the App Store –
OfficeSnip
2.  A pop-up will open with the apps available in the store.  You can now run a search for the app you wish to use
image

Since I wanted to use a web viewer add-in for PowerPoint, I typed Web Viewer into the search bar and hit Enter.  And what do you know?  Microsoft has created an app to do exactly what I wanted to do.  And it’s free!

image

I added the app to my slide and then entered the Datazen dashboard address I wanted to include.  Since it’s configured for public access, I wasn’t prompted for my user credentials and it was added and worked.image

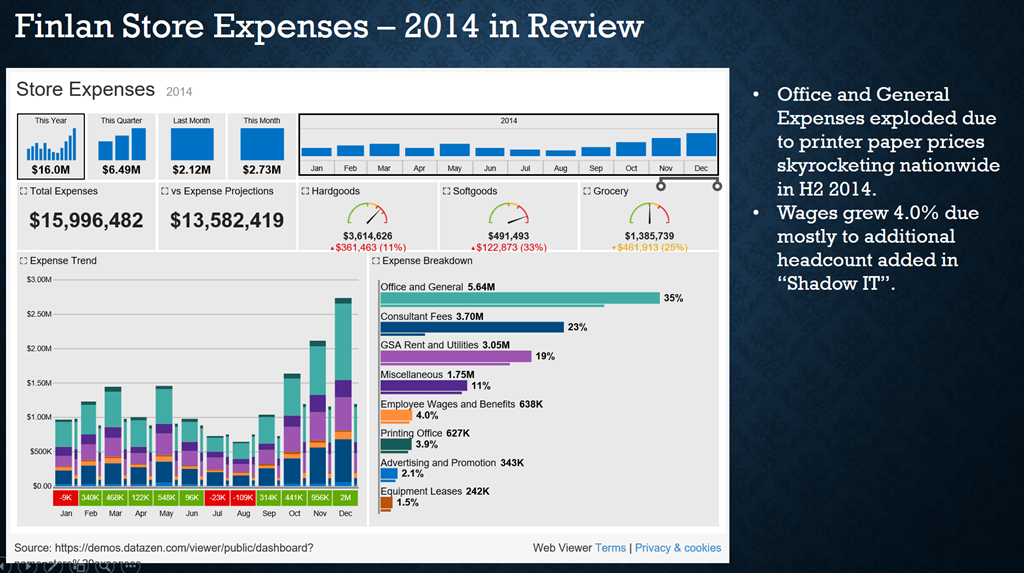
And since it is treated like any other slide element, I was able to redo my slide accordingly.  Ta da – I’m able to add proper commentary and still have a fully interactive, live dashboard!

image
This wasn’t too tough after all, and I didn’t mess around with my registry to get it to work.  Success!

Thanks for reading, and enjoy the rest of your weekend.

Using Datazen with Plus One to visualize your social media data

image

The idea for this post came from having spent the last year or so playing with a app called Plus One.  Check out their site to learn much more about it, but in short, it’s an app you download onto your desktop, enter the keywords you want to search across different social networks (Twitter, Facebook, etc.), and get back the results.    And in the FAQ, it states – “You are not limited to just the reports found within Plus One Social.  Because we store the data in a friendly desktop database, Microsoft Access, you can connect your favorite self serve bi tool . . .”

Naturally, I wanted to see if Datazen would work with Plus One, which meant I had to do a few things I hadn’t done before to get started –

– Install the Plus One application on Windows Server and
– Use Microsoft Access as a data provider

Installing Plus One is pretty straightforward – you go to this link, enter in your information, and they’ll send you the download link.  Download and install the app on the Windows Server you’re running Datazen on, and the Plus One icon will appear on the desktop.

image

This next part is tricky – BEFORE you try to open the app, you have to install two Access ACE ODBC drivers.  If you try to do it before that, you’ll get an error message.  The problem is, Datazen requires the 64-bit ODBC driver, while Plus One requires the 32-bit driver.  So how do we work around this?

1. Follow the instructions in this blog post to install the driver and setup the data source that Datazen needs.  However, use this data provider schema file as opposed to the one in the post because you need to leverage Access as your data source, not Excel.

2. Once that’s done, install the 32-bit Access Driver from here.  It’s from the 2007 version of Office, so there’s only one item to download and install.  That should allow you to open Plus One Social to get started.

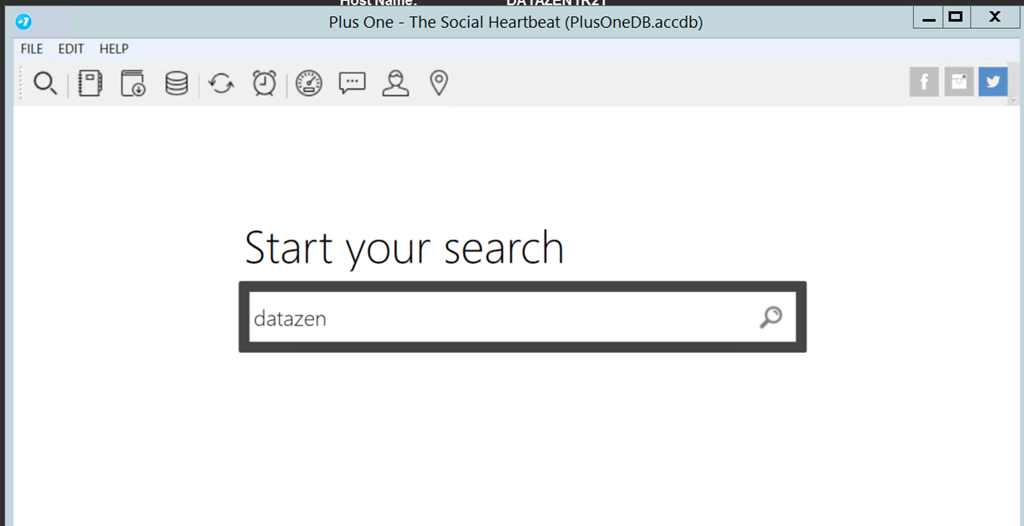
Open the app now, and you’ll see the search bar where you can enter your search terms.  I’m going to do a search for Twitter data related to Datazen (surprise, surprise), so I type in datazen.
image

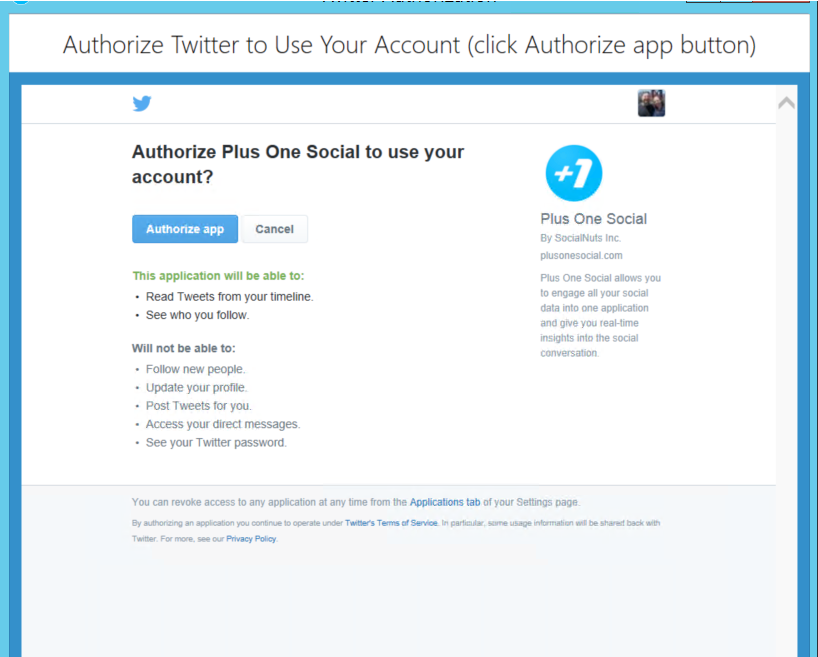
I’m asked to authorize the app on my Twitter Account (you need accounts with the different social networks you want to search across)image

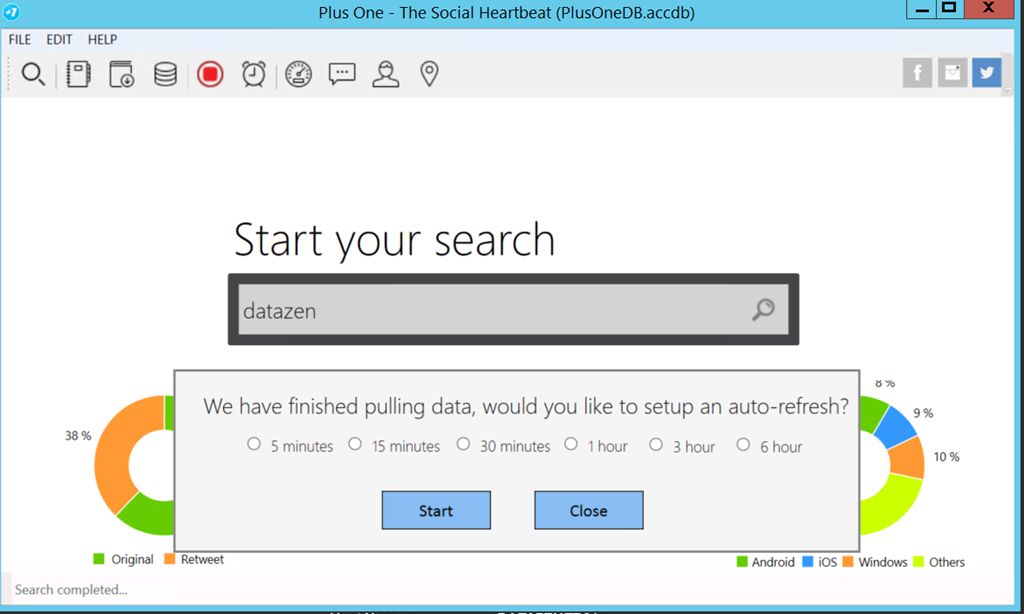
I authorize the app, and it grabs the results from Twitter.  It’ll then go and grab the last seven days of tweets (Plus One is limited to one week of data, so you’ll need to save it on a rolling basis to keep older data), and I can even setup an auto-refresh to get the latest data.
image
Now that I’ve got my Twitter data, I want to view it in Datazen.  The default Access database sits in the following folder location on the machine –

C:\Users\UserName\Documents\Plus One Social\PlusOneDB.accdb

If you were to open the file in MS Access, you’d see five tables with data – Hashtags, Mentions, Messages, Queries, and Users.  You can now write SQL queries against those tables in the Datazen server to pull back the data you need for your dashboard(s).  Let’s do one together.

I’ve got the Microsoft Access data provider all setup
image

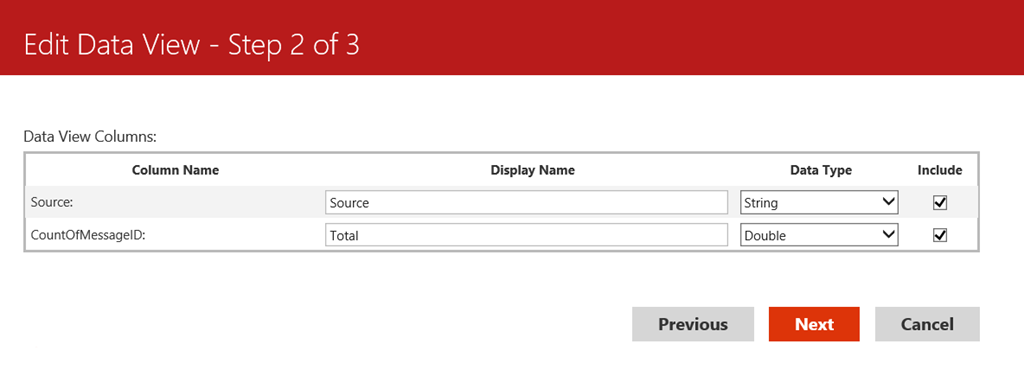
I want to see what platform people are using on my dashboard, whether it’s iOS, Android or something else.  So I’m going to write a simple case statement query to bring back the results.  Something like this –

SELECT Source = CASE WHEN Messages.Source like ‘%iPad%’ THEN ‘iOS’ When Messages.Source like ‘%iPhone%’ THEN ‘iOS’ WHEN Messages.Source like ‘%Android%’ THEN ‘Android’ ELSE ‘Other’ END,
Count(Messages.MessageID) AS CountOfMessageID
FROM Messages
Group By CASE WHEN Messages.Source like ‘%iPad%’ THEN ‘iOS’ When Messages.Source like ‘%iPhone%’ THEN ‘iOS’ WHEN Messages.Source like ‘%Android%’ THEN ‘Android’ ELSE ‘Other’ END

Except I get an error –
image

The issue here is you have to write the SQL Query like you would in Access, when doesn’t use case statements.  It does use switch statements, so I try that instead –

SELECT Switch (Messages.Source like ‘%iPad%’, ‘iOS’, Messages.Source like ‘%iPhone%’, ‘iOS’, Messages.Source like ‘%Android%’, ‘Android’,True, ‘Other’ ) as Source, Count(Messages.MessageID) AS CountOfMessageID
FROM Messages
GROUP BY Switch (Messages.Source like ‘%iPad%’, ‘iOS’, Messages.Source like ‘%iPhone%’, ‘iOS’, Messages.Source like ‘%Android%’, ‘Android’, True, ‘Other’ )

image
And that works without issue.  I went ahead and created seven different queries in total –
image
and set them up to refresh every hour, making sure I set it to run 10 minutes after I know my refresh on Plus One will finish.
image
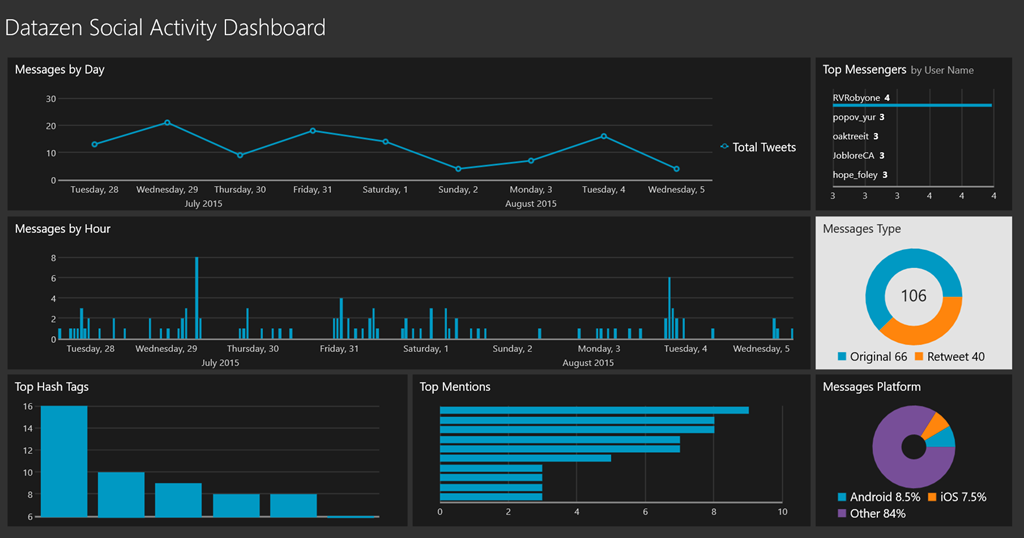
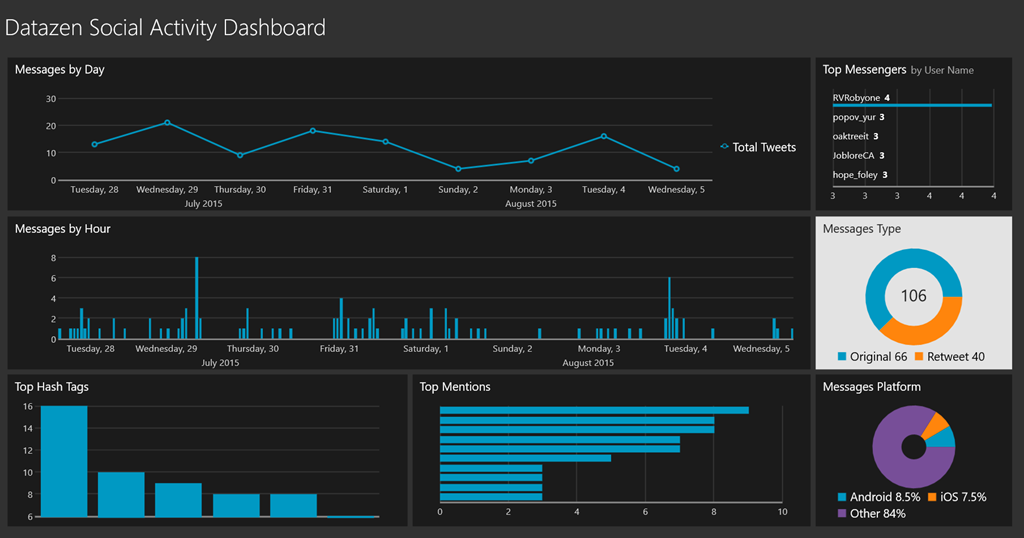
With that all setup, it was easy to create my dashboard (thanks to Datazen) and always stay on top of our social media activity.  This was the end result –
image

Thanks for reading!

How to setup your Datazen server to leverage Office365 for e-mail notifications

Happy Saturday everyone!

As promised, here is a quick follow-up to my post last week on how to setup a Datazen Test/Dev server in Azure.  As you’ll remember, I had you skip over the part where you setup you e-mail provider during the install wizard.  However, it’s pretty painless to now setup that information on your Datazen Server.  Couple quick caveats –

1. I’m admittedly showing you a method that is a little “hacktastic”, so I’d recommend you setup a dummy e-mail account to use for this purpose as opposed to simply leveraging your everyday Office365 account.

2. This is probably only necessary if you’re using the default Datazen authentication for your Datazen instance and don’t have an SMTP server in your organization you can leverage instead.

With that out of the way, let’s get started –

First, you’ll need your Office365 settings for SMTP e-mail.  You can find that by logging into your Outlook account on Office365 and going to this link.  You can also go up to the upper right-hand corner of the window and click on the gear icon, and then select Options

image

You can then look under Accounts –> POP and IMAP on the lefthand menu to find the SMTP settings

image

Once you have that information, open a Remote Desktop connection to the Datazen server you setup in Azure.  Once opened, navigate to the following path –

C:\Program Files\Datazen Enterprise Server\controlpanel\

You should see a web.config file.  MAKE A BACKUP copy of the file first just in case and save it somewhere safe.

image

Open the file in notepad and scroll all the way to the bottom until you find the mail settings.  It should look like this assuming you followed the steps I laid out previously.

image

To change the settings to leverage your Office365 account to send e-mails, you just need to change them to the following in between the tags –

Then save the file.  To test it, login to the control panel and add a new user to the server (this was all covered in the previous blogpost if you need a reference).  Once you’ve added him/her, you’ll see them listed with a “Set Password Link” next to their name –

image

You can now click on the “Send Reminder” link to send the e-mail to your user directly.  Assuming it was successfully setup in the web.config file, you should see a green success message just below the button.

image

And the user should get an e-mail in their inbox with an invitation to join the dashboard hub which looks like so.

image

They can then setup their account by entering their password after they click the link they receive.

image

That’s it!  You’ve now successfully setup your Office365 account to act as the mail server for your Datazen instance. 

I’ll be doing another blogpost in the next few days on how to setup a custom data provider and connect to a SAP HANA instance from your Datazen server.  Until then!