Excel-based Chatbots Powered by OpenAI API: A Game Changer for Business Automation

Introduction

The integration of the OpenAI API with Microsoft Excel is revolutionizing the way businesses interact with their data. One of the most exciting developments is the creation of Excel-based chatbots, which have the potential to automate various functions such as:

  1. Customer Service: Automate customer support by creating a chatbot that can handle frequently asked questions, troubleshoot issues, and provide guidance on product usage.
  2. Sales: Develop a sales chatbot that can assist customers in finding the right product, offer personalized recommendations, and even process orders directly from Excel.
  3. HR and Recruitment: Design a chatbot to automate the screening process, answer candidate queries, and schedule interviews.
  4. Inventory Management: Build a chatbot to help users track inventory levels, place orders for restocking, and provide real-time updates on product availability.
  5. Knowledge Management: Create a chatbot that can quickly retrieve information from internal databases, streamlining the process of accessing company data.

In this blog post, we will provide a detailed, step-by-step walkthrough for creating a chatbot within Excel using the OpenAI API. This guide is designed for novice Excel users, with easy-to-follow instructions and ready-to-use code snippets.

Note – Please be aware that this solution involves interacting with OpenAI’s API. I encourage users to familiarize themselves with OpenAI’s data usage policy (https://platform.openai.com/docs/data-usage-policy) and take necessary precautions to ensure the privacy and security of their data.

Step 1: Setting up the OpenAI API

First, sign up for an API key on the OpenAI website (https://beta.openai.com/signup/) and follow the instructions to get started.

Step 2: Creating a Chatbot Interface in Excel

  1. Open a new Excel workbook.
  2. In cell A1, type “User Input”.
  3. In cell B1, type “Chatbot Response”.
  4. Format the cells as desired for better readability.

Step 3: Enable Excel Developer Tab

  1. Click on “File” > “Options” > “Customize Ribbon”.
  2. Check the box next to “Developer” in the right column and click “OK”.

Step 4: Add a Button to Trigger Chatbot

  1. Click the “Developer” tab.
  2. Click “Insert” and select “Button (Form Control)”.
  3. Draw the button below the “User Input” and “Chatbot Response” cells.
  4. Right-click the button, select “Edit Text,” and type “Submit”.

Step 5: Write VBA Code for OpenAI API Integration

  1. Right-click the “Submit” button and click “Assign Macro”.
  2. In the “Assign Macro” window, click “New”.
  3. Copy and paste the following code into the VBA editor:
Option Explicit

Private Sub Submit_Click()
    Dim userInput As String
    Dim chatbotResponse As String
    
    ' Get user input from cell A2
    userInput = Range("A2").Value
    
    ' Call OpenAI API to get chatbot response
    chatbotResponse = GetOpenAIResponse(userInput)
    
    ' Display chatbot response in cell B2
    Range("B2").Value = chatbotResponse
End Sub

Function GetOpenAIResponse(userInput As String) As String
    Dim objHTTP As Object
    Dim apiKey As String
    Dim apiUrl As String
    Dim jsonBody As String
    Dim jsonResponse As String
    Dim json As Object
    
    ' Set your OpenAI API key here
    apiKey = "your_openai_api_key"
    
    ' Set OpenAI API endpoint URL
    apiUrl = "https://api.openai.com/v1/chat/completions"
    
    ' Create JSON request body
    jsonBody = "{""messages"": [{""role"": ""system"", ""content"": ""You are a helpful assistant.""}, {""role"": ""user"", ""content"": """ & userInput & """}], ""max_tokens"": 50, ""n"": 1, ""stop"": ""\n"", ""temperature"": 0.7}"
    
    ' Create an HTTP object
    Set objHTTP = CreateObject("MSXML2.ServerXMLHTTP.6.0")
    
    ' Send the request to OpenAI API
    With objHTTP
        .Open "POST", apiUrl, False
        .setRequestHeader "Content-Type", "application/json"
        .setRequestHeader "Authorization", "Bearer " & apiKey
        .send jsonBody
        jsonResponse = .responseText
    End With
    
    ' Create a JSON parser object
    Set json = CreateObject("MSXML2.DOMDocument.6.0")
    json.LoadXML jsonResponse
    
    ' Extract chatbot response from JSON and return it
    GetOpenAIResponse = json.SelectSingleNode("//content").Text
End Function

  1. Replace your_openai_api_key with your actual OpenAI API key.
  2. Save the VBA code by clicking the floppy disk icon or pressing Ctrl+S.
  3. Close the VBA editor by clicking the “X” in the top-right corner.

Step 6: Add Microsoft XML Reference for JSON Parsing

  1. Press Alt+F11 to open the VBA editor.
  2. Click “Tools” > “References” in the menu.
  3. Scroll down and check the box next to “Microsoft XML, v6.0” (or the latest version available).
  4. Click “OK” to close the “References” window.

Step 7: Test Your Excel Chatbot

  1. In cell A2, type a question or statement for your chatbot (e.g., “What is the capital of France?”).
  2. Click the “Submit” button.
  3. The chatbot’s response should appear in cell B2.

(Optional) Step 8: Add Context Awareness to Your Excel Chatbot

  1. In your Excel workbook, create a new sheet and rename it to “ConversationHistory”.
  2. In the VBA editor, modify the Submit_Click() subroutine by adding the following lines of code before the line chatbotResponse = GetOpenAIResponse(userInput):
    ' Save user input to ConversationHistory sheet
With Sheets("ConversationHistory")
.Cells(.Cells(.Rows.Count, 1).End(xlUp).Row + 1, 1).Value = "User: " & userInput
End With

3. Modify the GetOpenAIResponse() function by adding a new argument called conversationHistory:

Function GetOpenAIResponse(userInput As String, conversationHistory As String) As String

4. Update the Submit_Click() subroutine to pass the conversation history when calling the GetOpenAIResponse() function. Replace the line chatbotResponse = GetOpenAIResponse(userInput) with the following code:

    ' Get conversation history
Dim conversationHistory As String
conversationHistory = Join(Application.Transpose(Sheets("ConversationHistory").UsedRange.Value), " ")

' Call OpenAI API to get chatbot response
chatbotResponse = GetOpenAIResponse(userInput, conversationHistory)

5. Modify the JSON request body in the GetOpenAIResponse() function to include the conversation history. Replace the line jsonBody = "{""prompt"": ""Chatbot: " & userInput & "\", ""max_tokens"": 50, ""n"": 1, ""stop"": ""\n"", ""temperature"": 0.7}" with the following code:

    ' Create JSON request body with conversation history
jsonBody = "{""prompt"": """ & conversationHistory & " Chatbot: " & userInput & "\", ""max_tokens"": 50, ""n"": 1, ""stop"": ""\n"", ""temperature"": 0.7}"

6. Finally, update the Submit_Click() subroutine to save the chatbot’s response in the “ConversationHistory” sheet. Add the following lines of code after the line Range("B2").Value = chatbotResponse:

    ' Save chatbot response to ConversationHistory sheet
With Sheets("ConversationHistory")
.Cells(.Cells(.Rows.Count, 1).End(xlUp).Row + 1, 1).Value = "Chatbot: " & chatbotResponse
End With

With this optional modification in place, your Excel chatbot will now maintain a conversation history in the “ConversationHistory” sheet, which will be used to provide context-aware responses. The chatbot will be able to give more accurate and relevant answers based on the user’s previous interactions.

Conclusion

You now have a working Excel-based chatbot powered by the OpenAI API. This guide has provided you with a simple, step-by-step approach to creating a chatbot interface within Excel and integrating it with the OpenAI API using VBA code. While this example uses basic functionality, you can expand and adapt the code to create chatbots for various applications, such as customer service, sales, HR, inventory management, and knowledge management. With the power of the OpenAI API and the familiar Excel interface, businesses can create powerful, user-friendly tools to enhance operations and boost productivity.

This blogpost was created with help from ChatGPT Pro.

Use Outlook Shortcuts to organize your favorite Power BI Reports and Dashboards

image

I haven’t written in awhile, but wanted to get this up while it was still fresh in my mind (and had some time left at lunch).

Did you know Outlook had a shortcuts feature?  I didn’t (or at least I didn’t remember I did), and this video was the only one I could easily find on the topic.  Ostensibly, it’s used to create shortcuts to folders in Microsoft Outlook that you can quickly jump to.  However, as I found out, you can also use it to jump to web content, including content in Power BI!  Just follow these simple steps –

1. In Outlook (I’m using Outlook 2016), head to the shortcuts pane by finding the ellipsis at the bottom of your left-hand navigation area and choose “Shortcuts”
image

2. By default, you’ll see two shortcuts

image

To start adding web pages as shortcuts, I want to have them organized, so I’m going to right-click on the “Shortcuts” top menu option and create a new shortcut group called “Power BI”.

image

3. Once I’ve done that, it should look like this –

image

I can now add a web address as a shortcut, but I need to do this in a slightly different way than you might expect.  To do this, I’ll highlight the url in my browser that’s open like the following –

image

I’ll then drag this address under my new shortcut group in Outlook and give it a friendlier name (using my right-click menu option to rename the shortcut) so it looks like the following –

image

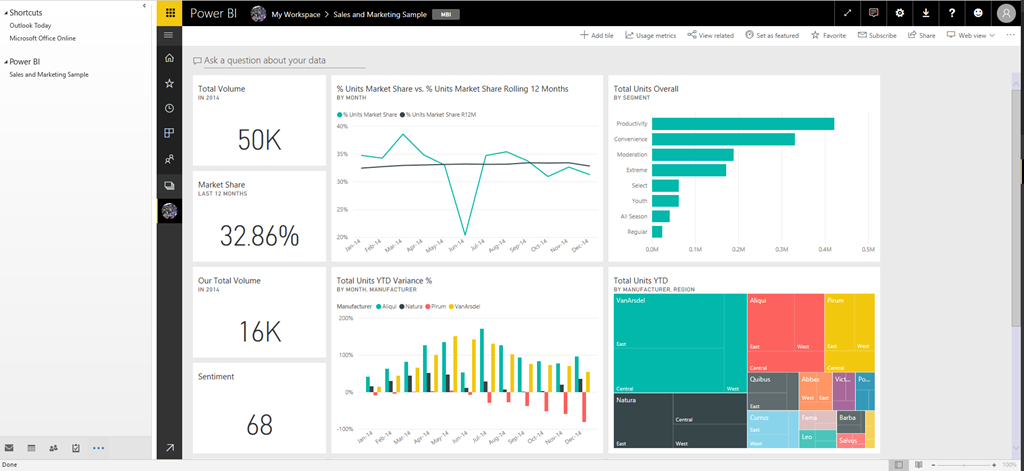
Now when I click the link, it looks like this in Outlook –

image

Not only that, it’s fully interactive and I can (seemingly) do all the same things with my dashboard or report I’d do in a separate browser

image

I have to be honest – I’m surprised this works as well as it does, and it’s much better than almost any other web page you might pull in there in my limited testing.  And maybe this isn’t that helpful to some folks, but I worked with a lot of former execs who would’ve LOVED to have been to simply to do everything right in Outlook.

Thanks for reading!

How to insert a live SQL Server 2016 Reporting Services report into a PowerPoint slide

Capture

For Memorial Day, I wanted to revisit one of the most popular blog posts I’ve written, which was about how to insert a live Datazen dashboard into a PowerPoint slide.  As we transitioned the Datazen functionality in SQL Server 2016 Reporting Services, I wanted to make sure this still worked with Reporting Services.  Let’s walk through the steps again you’d use to enable this functionality (you’ll need Office 2013/2016 or Office365 for this) –

1.  Go to the Insert Tab in PowerPoint.  You should see the Store Add-In in the ribbon.  Click it to open the App Store –
OfficeSnip
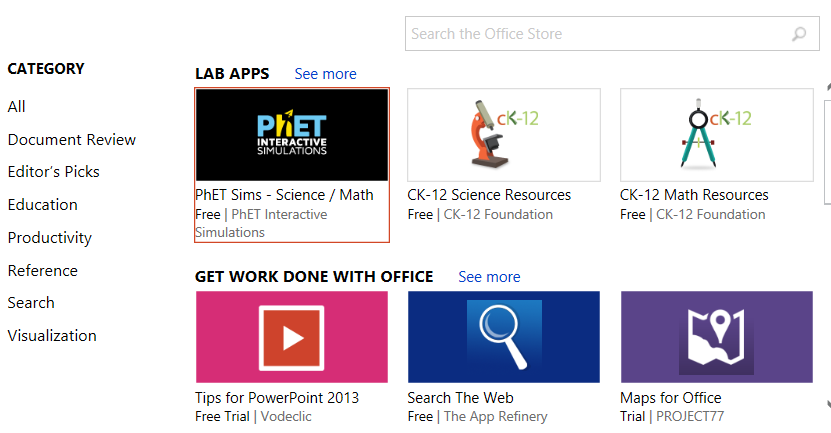
2.  A pop-up will open with the apps available in the store.  You can now run a search for the app you wish to use
image

Type Web Viewer into the search bar and hit Enter.  You see the Web Viewer app created by Microsoft, which is what we’ll use.

image

I added the app to my slide and then entered the address for my Reporting Services site.  And this is what came up –

image

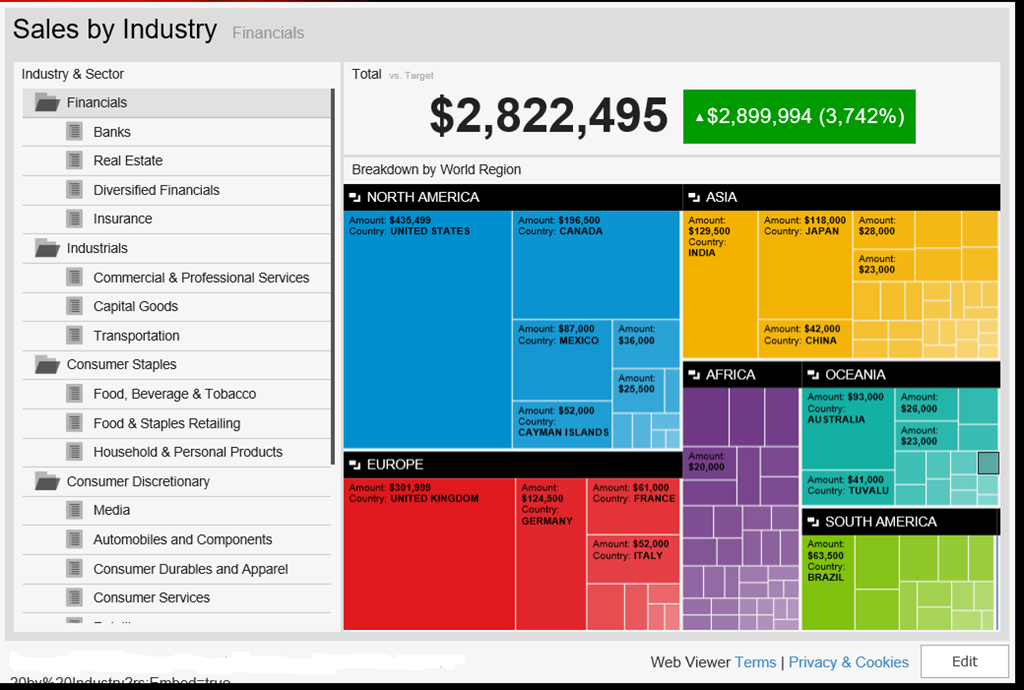
Curses!  But wait – I don’t really want to go to the home page and browse to my report.  I want to go to directly to my report, so I want to use the report address and the embed functionality we introduced in RC1.  When I do that, it works perfectly –

Capture2

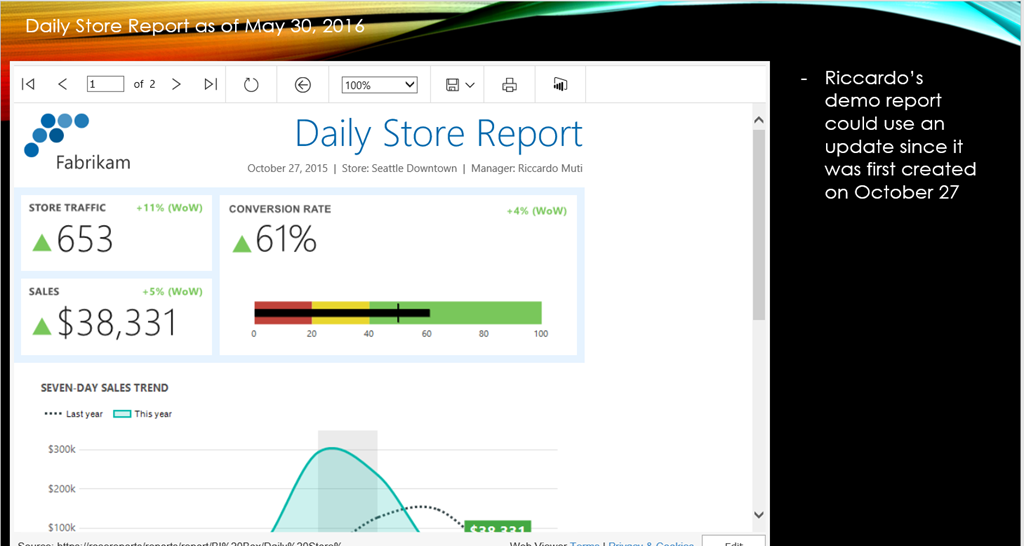
I know what you’re thinking – does this mean it also works for paginated reports in Reporting Services using the embed url?  Yes it does!

image

Also, all of your security rules are still active on your reports, meaning you could provide this powerpoint deck to several people who would then only see the reports and/or data they have access to (row level security will depend on the security rules you have in place in your organization).

I’ve done hundreds of customer visits in the last few years, and I’d be hard-pressed to think of one that wouldn’t have a use case this scenario would readily address.  And it seems to cover the objections I’ve heard previously –

– It’s an app made by Microsoft
– It respects your security in Reporting Services, so it can be shared freely if needed and have people see only the reports/data they have access to
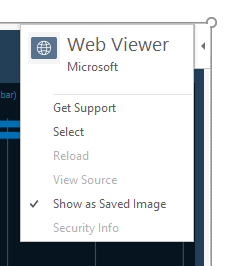
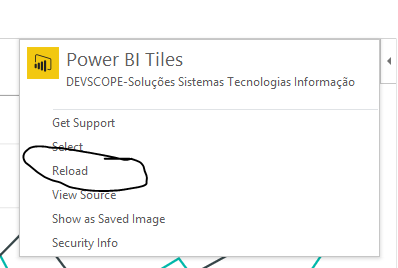
– You can still use your deck offline if you’d like by selecting the “Show as Saved Image” functionality in the app flyout menu in the upper right-hand corner (shown below)
image

This is a great way to get a ton of additional value out of your Microsoft investment at your organization, and I encourage all you to give a try.  Until next time!

Perfect Data Poppycock – Part 4 of the Powerful Productivity Series

I wasn’t planning on this being part 4 of this blog series.  No, the plan was to do an end-to-end scenario using real data and a real business use case.  Instead, you’re getting a rant that I’m dressing up as a blog post.  The rant of a man who spent his Saturday afternoon doing what’s the hardest part of any BI project – actually getting the data and making sure it is clean and correct.

There’s been a number of new announcements recently around new analytics solutions from companies like Amazon, SAP and Tableau.  The announcements all had a similar theme – we’ve got a snazzy new product that will help people to easily explore, visualize and analyze their data.  And to show you how ground-breaking it really is, they give you a chance to try it using one of their pre-loaded sample datasets.  With just a few quick clicks, you too can make a bar chart that shows you how much ticket sales were for Jurassic World.  Or better yet, how many third class passengers died on the Titanic!

Yes, the best friend of BI pre-sales personnel everywhere, these perfect public datasets do a fantastic job helping tell the story you want customers to hear – just take your perfect dataset (preferably a single table on a spreadsheet), load it up and watch the magic happen.  And everyone uses these datasets – yes, including here at Contoso Microsoft.  It’s just the reality of doing demos – privacy concerns make using real company data very tricky, you don’t want the demo to go wrong, etc.  So like the latest Macklemore video, these demos look great at first glance, but trying to find any actual meaning around the information being presented is probably wasted energy.

That was why I wanted to finish off my perfect productivity series with a grand finale – use real data and a real business scenario that showcased the value of Power BI and Office 365.  And I had an excellent one – my wife runs an online business I help her out with from time to time.  She’s had some moderate success with it, but she’s never really used the data in any meaningful way, other than the normal tax stuff one has to do.  She suggested I look at the data to see if there were some things she could be doing to make more money at it.  Jackpot!

So yesterday, I sat down to dig into the data – surely, this was going to be a piece of cake.  All the data was in a central location, I knew the business, etc.  That’s when I ran into a data access problem.  The site she sells the items on only lets you get the records for the current month and the past three calendar months.  Since she had sales going back to October 2013, that wasn’t going to help.  I then tried pulling the data from a site called Terapeak, which I love to play with because it has historic sales data, but they too limit the number of records you can download.  Gee, what a surprise, central IT was preventing me from getting the data I needed to do my job . . .

After I snapped out of my shadow IT flashback, I did what I used to do in these situations.  I figured out how to work around the data access limitations.  I discovered the data was also available from PayPal, and those you could run for a custom time period.  Woohoo!  So I ran the report, downloaded the file, and opened it up in Excel to review the data before I got started.  That’s when the “fun” began.

The first problem was PayPal had two records for each item someone bought, one that reflected the item when it was in the shopping cart, the other when it was it actually paid for.  It looked like this –

image

Then I noticed there was stuff in the download that had nothing to do with the sales themselves, but were potentially for office supplies or the like.  Plus it had a bunch of extra columns, date formatted in a dumb way, etc.

No big deal for me – Power BI desktop and Power Query in Excel eat these types of problems for breakfast.  And unless I missed something in my BI 101 class, no snazzy visual or finger gesture on my tablet is going to make up for the fact my dataset from the company’s “single source of truth” is giving me complete garbage.  Oh, but it gets better – this particular report included all the listing information, including the listing title, but didn’t include the listing category, which I needed.  So I’d have to recreate that myself for the purposes of this report, based off of the item title.  Also, the publication year for the item being listed, which was very helpful for certain listings, was buried in with the main title text.  I needed to pull that out and make it its own column.  It was becoming clear that my grand plans to play Witcher 3 all afternoon were evaporating fast.

We’re now teetering dangerously close to Ken Puls/Bill Jelen/Rob Collie territory in terms of ability required to make this happen, and last time I checked, there weren’t folks like this littered across every department of companies I’ve spoken to (see my previous post for some context on that).  Unless of course, I’m simply muscling through the spreadsheet and typing values into new columns manually as I eyeball each line.  Which is EXACTLY WHAT 99% OF PEOPLE WHO THESE NEW TOOLS ARE MARKETED FOR WILL DO.  It’s going to be faster for the vast majority of people in the short term.  Or maybe you’re using Google Docs, or haven’t heard of Power Query, whatever.  But not ME.  No, I’m going to make the folks at PASS proud by writing this great M script and –

If you’re thinking that ends with the phrase, weep like a baby when you notice yet another data issue, you’ve obviously been on this goat rodeo before at a customer site.  As I went to start my data import, I looked more closely at the title field – in the report, if someone bought multiple items in the same transaction, it only lists it as a single transaction line item, with a summarized sales amount.  BUT, it has all the items bought as separate values in the item title field, separated by commas.  So it looked like this –

image
Sadly, Bo didn’t know profits.

I knew what each item’s sales price was for, because the prices were always the same for the same types of item – for example, an old book would be listed for $9.95, and old Xbox game would be $14.95, etc.  But I still had to break these records into individual line items and then adjust the value on each line to reflect what the price was for that item only, since the overall item total would be copied to each line.

Uncle.

I’m sure it’s possible to get an M script that would automate this, and I’ve done stuff like that before in SQL Server, but I wasn’t about to fiddle with it for the 175 or so rows I needed to clean up.  I sucked it up and did that part of it manually in Excel.  The rest of the data clean-up I outlined I did do in Power BI desktop, but it took some custom M script, two Ken Puls articles (this one is especially useful) and about 200 (!) steps.  Oh and about nine hours of my time.  And Geralt’s time.

But the pain was all worth it – my properly cleaned dataset contained some remarkable insights that I was able to light up in Power BI with some of the new custom visuals that were introduced last week.  And it also reminded me of what it’s like in the real world, because this scenario happens every day, in every company in almost every department.  It certainly happened in my old group more often than my boss coming to me with a perfect data export of Titanic deaths he was looking to throw a pie chart on.

Jen Underwood touched on this theme in her post asking if you’d bought a self-service BI fantasy.  I’d take that one step further – you might need to ask yourself if you’ve bought a corporate BI fantasy as well. Because for all the flaws people feel the Microsoft solutions might have, it’s the only one I’ve found was designed and consistently used as part of every solution here in the real-world, where data is messy or unavailable or both.  And we’ve got pretty great visuals as well – ever seen a Datazen dashboard or that cool fishbowl in Power BI?

Have a great week at PASS!

Game Change – Part 3 of the Power BI and Office 365 Powerful Productivity Series

image
What happened this week may go down as one of, if not the most, important weeks in the history of Microsoft Business Intelligence.  Melodramatic nonsense from a Microsoft fanboy/employee?  Hmm – maybe.  Let me explain why I’m making this bold statement.

So, I’m not normal.  Neither are probably most (if not all) folks reading this blog.  That’s a good thing, because it makes us special.  We’re blessed with what Rob Collie refers to as the “Data Gene”, and it’s why we love working with the Microsoft stack.  It’s estimated (by Rob) that approximately 1 in 16 people have the data gene, in fact.  Which means 15 out of 16 people don’t have it.  They aren’t interested in crunching numbers all day, nor should they be.  It isn’t their job.  Which is why the presentation layer and integration with a productivity suite like Office is so important in any business intelligence solution – users need to be able to quickly and easily understand what’s being presented and take action on the information.  These are themes I discussed at length in Part 1 and Part 2 of this series.

When I joined Microsoft in 2013 in my pre-sales role, I quickly learned two things –

1. The vast majority of people I was presenting to weren’t the ones reading every blog post from Marco Russo or Jen Underwood.  They generally didn’t know or care what DAX was.

2. If they couldn’t see how they’d get business value from it personally, then they weren’t interested.  This doesn’t mean they’re selfish – on the contrary, it means they’re pragmatic.  And it is exactly how I’d feel if I was in their shoes.

Which meant if I spent a lot of time talking about how great the CALCULATE function was (and still is!) in Power Pivot, unless I had that one person in the room out of sixteen who had the data gene, I’d lost my entire audience right then and there.  Forget about the sales context – the reason I wanted to do that job was summed up nicely in this tweet I saw from Hope Foley the other day –
image
Yep, sounds corny, but it’s true.  And I knew I could help them solve their business challenges with our stack.  So I wanted to be sure to highlight functionality which THEY were telling me would help them the most, not just what I thought would.  Think back to the pre-Power BI era at Microsoft, which is when I joined – what two things do you think folks told me was the most valuable functionality I showed them?

1. The ability to export to PowerPoint from a Power View report in SharePoint was easily first
2. The decomposition tree in PerformancePoint in SharePoint was easily second

There wasn’t a close number three I could point to – at each customer presentation I did, if I showed these two pieces of functionality, they’d be the ones customers wanted to start using “tomorrow” because of the amount of value they thought it would bring their organizations.  What usually happened when I finished was, the customers marched right from the presentation down to IT and demanded they deploy the latest version of SharePoint and Office in the organization so they could use this functionality.  Naturally, IT said “Absolutely!  We own these licenses already and we’ve been itching to do this.  We’ll have you up and running in no time!”  Then they joined the rest of the Care Bears on Gumdrop Mountain to celebrate their good fortune.

I’m guessing you figured out I was being facetious.  For many customers, it was simply too much work for them to get all the pieces in place to take advantage of this functionality.  This was frustrating, but completely understandable coming from where I’d been in “shadow IT”.  So we only saw a fraction of the adoption you’d expect based on the interest shown in the presentation.  Fast forward to this week and what was announced.

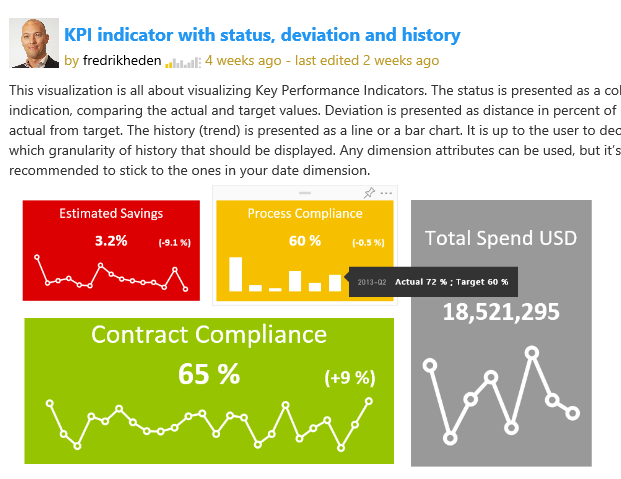
The first announcement came a week ago in the Power BI visualization contest.  Fredrik Hedenström submitted his second entry in the contest – now, it would be hard to top his first (which of course I loved – I am sure you can guess why looking at this picture of it)
image
Go Frederik Go!

But he may have done just that.  His entry this week was for a visual called Breakdown Trees.  When I saw it, I smiled.  Frederik basically took the decomposition tree from PerformancePoint and put it into PowerBI.

Power BI version
BT_Screendump1.png

PerformancePoint version

Remember, this was one of two things our largest customers told me they saw providing the most value to their organizations when I showed it to them.  And now, instead of just seeing it with AdventureWorks data being demoed, they could now be using this functionality, with their data, in the same meeting.  That’s absurd (in a good way)!

Maybe you’re thinking “Pfft – that was over two years ago.  I mean, Datazen didn’t even have an iOS app yet.  Times change, man!”

I seriously doubt that people won’t want this functionality as much now as they did then, but I’ll concede the point for the sake of argument.  The other announcement that came a few days later was even bigger than the first one.

image
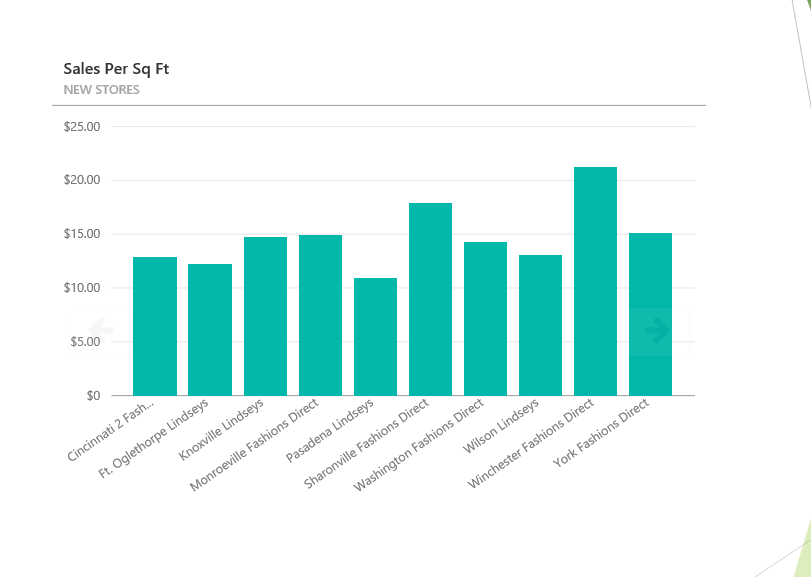
A company called DevScope created an Office Add-In that allows me to insert tiles from my Power BI dashboards into PowerPoint, Excel, or Access.  I’ve talked about Office Add-Ins before in a previous article, which was one of my most popular posts to date.  As I read through the blog post which showed me how to add the tiles, I thought to myself “It can’t possibly be this simple.”  So I tried it and followed the steps in the blog –

1. Insert the Power BI tiles in the document
image
image

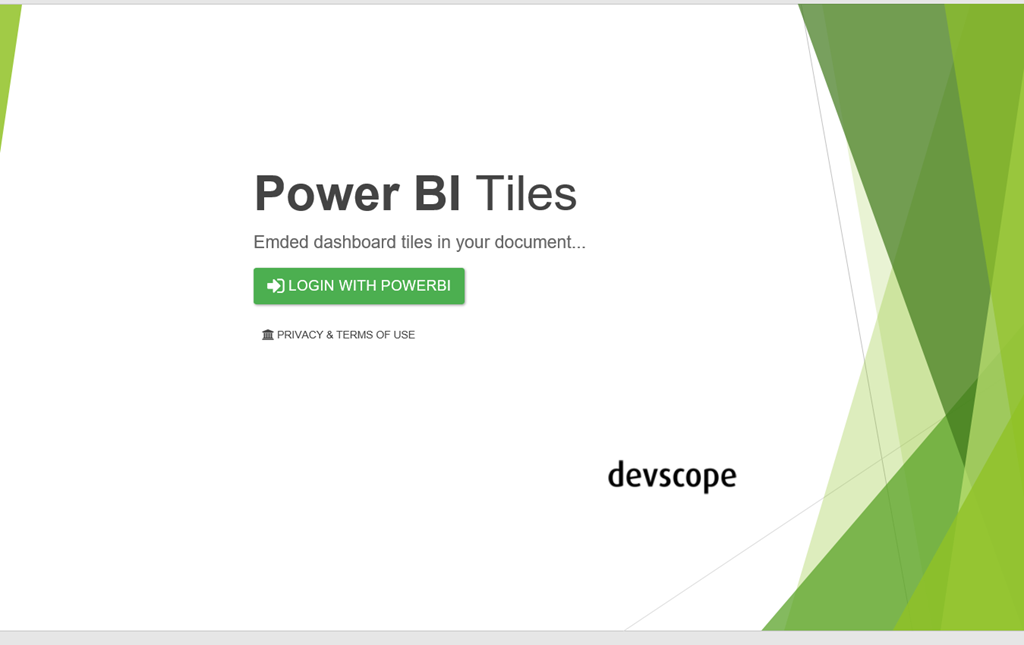
2. Click at the login button and authenticate with your Power BI credentials at the shown popup.

3. Select the Dashboard and the desired PowerBI tile:image

image

I now had two questions –

1. Can I refresh the data?  Yep
image

2. What if I send it to someone who doesn’t have the app?  You still can, just choose the “Show as Saved Image” option.
image

OMG – this changes everything.  Here’s why –

1. For two years, every organization I met with asked for this type of functionality in every meeting.  That’s over 100 of the largest Microsoft customers in the world.  Even after Power BI was introduced and became the focus of many of my conversations, they have the same ask.  The ability to get their live dashboards into PowerPoint slides OR line of business apps.

2. The level of difficulty to get this setup for an organization has gone from “complex” to “trivial” if they’re running a newer version of Office.  Many more customers are actively using Office 365 and 2013/2016 than were using it two and a half years ago, so that isn’t the barrier it once was.

3.  Well, what if an organization is instead using Office 2010 as the standard?  It used to be that would be an enormous blocker to even try Power BI.  Now, it doesn’t matter for Power BI, since I can sign up and use that immediately regardless of Office version.  But I wouldn’t be able to use the app, right?  Replay that fanciful conversation the folks had with IT earlier – instead of needing to have setup

– SharePoint 2013
– SQL Server
– SQL Server Analysis Services,
– SQL Server Reporting Services
– PowerPivot for SharePoint add-in
– Office 2013 for the client machine
– Hardware or VM’s to run everything on
– The Silverlight add-in on the client machine
– Proper security integration, proper licenses, stakeholder buy-in, etc.

to get functionality they saw me demonstrate, I just need one machine with an updated version of Office (32 or 64-bit) to get this functionality.  I can think of exactly two customers during my time in the field where they wouldn’t provision a single machine with the latest version of Office on it or allow the person to upgrade.  In general, it wasn’t a big deal to get a couple folks using a newer version of Office to prove out the value of the solution.  So I show them in the presentation they can do this.  Then they sign up and do it right away with their Salesforce.com data, and the only thing preventing them using it in every PowerPoint presentation they create is a slower deployment of Office?  That’s a much, much easier thing for them to get done, and I assure you, people will make the ask to do so just to get this.

4. This is the biggest one, and I am convinced of this – this functionality is so simple and so valuable, people will sign-up for Power BI to use this functionality even if they already own and use another tool.  Forget about how easy it was to do – as far as I know, NONE of the other major self-service BI vendors I just mentioned can do what I just did at all, let alone that easily with three major pillars of the productivity suite that people use every day.  It was that important to every business I’ve ever worked at, talked to, whatever.  And because I don’t need every user to have the app downloaded, (remember, it still allows them to see the data as a static picture if they open it and don’t have the app), I’d be giving this an AWFULLY long look if I’m currently taking 30 snapshots of my Tableau/Qlik/Lumira/Whatever report and pasting them into a PowerPoint deck every week.

It’s not a perfect app – yet.  If I have 50 tiles in my slide deck, yeah, refreshing each one at a time would get to be tedious (yet still much faster than my current option).  To paraphrase Voltaire, “Don’t let perfect get in the way of good.”  This app is really good as is, and it’s been available for all of two days.  The only folks who wouldn’t get any value from this are the ones who can’t take advantage of Power BI at all.  To them I say, read the latest blog post from my colleague Riccardo Muti this past week who shows off the newest functionality in SQL Server Reporting Services in SQL Server 2016 CTP 2.4, available now.

Yep, we added the ability to Export to PowerPoint there as well.  And it looks GREAT when you export the report, thanks to the other enhancements they’ve made.

So, what do you think?  Did Microsoft truly change the game this week?  Before you answer, go ask some non-BI pros if they’d find the functionality I just described to you something they’re looking to use in their jobs.  I think you may surprised just how valuable something so simple might turn out to be.

Enjoy your weekend!

Combine Excel Online and Load on Demand to power up your Excel data source in Datazen

image

I hadn’t planned on a post today, but after watching the Philadelphia Eagles get their first win of the season, I was inspired to do something I’d first thought about a couple weeks back.  Specifically, I wanted to use an Excel document as a data source in my Datazen dashboard, but enable Load on Demand capabilities so I could take advantage of parameters.  I also wanted to see how that would work in combination with people just typing in data into the Excel sheets that are the data source.  How quickly would I see their changes in my Datazen dashboard?

Out of the box, Datazen allows you to use Excel files in a shared folder as a real time data source.  And in the post I did around combining Datazen dashboards with Power BI Q&A functionality, I first talked using the sync capabilities of OneDrive to sync an Excel file from my local drive to the Datazen server.  The thought was, that way if I refresh a data source locally, I can have it sync up to the server.  The issue I saw with using this as the solution for this scenario were two-fold –

1. I was the only person updating information in this scenario.  Ideally multiple people could make updates using Excel Online at the same time.

2. I couldn’t do parameters with the out of the box Excel data source in Datazen.

Well, what if I used the workaround I mentioned about how you could use Excel files as a data source for KPI’s?  Since that had you using Excel like SQL, maybe then I could use parameters.  Let’s give this a shot.

In my Datazen server, I’m going to create a new data source called Excel as SQL, using the instructions from the blog post I referenced –
image  I’m going to create an Excel file with two tabs – one has Category, Amount and Target along with some sample data.
image
The other just has Category and a single sample value.
image
I then save my file.  It’s now available to me either on the server or in a web browser via Excel Online, thanks to OneDrive.
image

On the Datazen server, I’m going to create two SQL queries to use.  The first one, called Data, looks like this –
image

You see I’ve setup a parameter called @Product to use – here’s what that looks like
image

I used a default value to make sure I get back at least one value, otherwise the Datazen Publisher won’t be able to build the data view properly.  Next, I’ll build my other query called FilterValues.  It’s pretty basic –
image
Now I can build my dashboard.  I’ll bring in two elements – a Selection list and a Number with Delta.
imageThen bring in both of the data feeds and hookup the data to the dashboard elements.
image
I’ll setup my parameter to be equal to what’s passed into my dropdown list.
image
Now I publish my dashboard.  When I hit it from a web browser or app, I get back what I’d expect to.
image
This is fine, but I’ll want to add more items on an ongoing basis.  If I try to open the document and make the changes directly on my desktop, the data source is locked and not available to Datazen –
image
But, if I instead make the changes in Excel Online, the changes get synced and my data source isn’t locked!  This is true even if I have multiple people adding items at the same time.  I’m going to update my Excel Online document by adding a number of new categories (as suggested by my children) –
image
How quickly these show up can vary – I’ve had it in as little as 5 seconds, and sometimes it’ll take up to a minute.  For example, these showed up by the time I finished typing the previous sentence.
image
And I’ll now update my data in the other sheet as well.
image
What’s cool here is I don’t need to refresh the page to see this new data, since it’s always going to back to the original data source thanks to Load On Demand.  Once my data shows up, my values are automatically updated when I change the dropdown.
image And notice I added the Seahawks data – I’ll never see that as a value if unless I add it to the dropdown as well.

This offers some great flexibility for folks to manage data and make updates this way.  You could also do multi-select values vs. a single value by changing your SQL statement and allowing multi-select in your dropdown list.

Thanks for reading everyone!