Use Microsoft Flow to archive PDF’s of your Paginated Reports in Power BI

With the recent announcement around E-Mail Subscription support for Paginated Reports in Power BI, you can now have full PDF’s of those reports sent to your inbox on a regular basis. This has been an ask for quite some time in Power BI, but many users have also been looking for the ability to subscribe and have these files delivered a specific location as well, like a OneDrive for Business folder. While we don’t have native functionality for that yet in Power BI, you can use Microsoft Flow to achieve this by taking the e-mail attachment from your inbox and moving it.  Here’s a step by step way to do just that.

First, go to https://flow.microsoft.com/ and do a search for “OneDrive”

The first result returned (for me, anyways) is “Save Office 365 email attachments to OneDrive for Business”

image

Select that, and you’ll see the following recipe –

image

It’ll confirm you’ve provided your credentials for both Office 365 Outlook and OneDrive for Business

image

At this point, you can simply hit “Create Flow” and be done if you wanted to.  However, if you do so, all attachments sent to your Office 365 inbox will be saved in a folder called “Email attachments from Flow”.  Instead, you might not want EVERY attachment in your inbox to go into this folder, but instead just the ones from your Power BI subscriptions, or maybe just a few specific subscriptions.  If that’s the case, we’ll need to make a couple quick changes.  Hit the “Edit” button at the top of the screen

image

The recipe will look like this right now

image

Click on the “Show Advanced Options” under new email.  You’ll see a number of new options you can set to narrow the criteria under which this Flow will run.

image

I’m going to set one where the Subject Filter is based on my e-mail subscription subject name

image

Now it’ll only be done for that particular subscription.  However, I’d like it to add the date to the name of the file so I can easily keep track of which PDF file is for which date.  To do that, I’m going to edit this item

image

by adding two new steps and modifying the “Create file” to append the date to the attachment name.  Add two “Compose” steps – in the first, add the attachment name.  In the second, add the following expression  –

concat(utcnow(‘yyyy-MM-dd’),’_’,outputs(‘Compose’))

Finally, change the “Create file” name to the Output of Compose 2.  This will change the file name to a combination of the date and the attachment name.   Once you’re done, your steps in the “Apply to each attachment” item should look like this –

image

And your entire Flow like this –

imageimage

To make sure it works, let’s test it out.  I’ve sent myself a sample e-mail

image

So I’ll run a Test clicking the “Test Icon” in the upper right-hand corner

image

And I’ll use the data from Office 365 Outlook, since I already have the mail in my inbox

image

The test runs, and says it has been successfulimage

Checking my OneDrive folder, I see that sure enough the attachment is there with the proper date format appended.

image

That’s all you need to do.  Just hit save, and it’ll automatically run against your inbox on an ongoing basis without any work needed on your part.

Microsoft Flow, in combination with Power BI Paginated Reports, provides a powerful way to save report snapshots or, with several additional file types soon to be available for your paginated reports subscriptions, data extracts, in a central location for you to easily archive and share.

Thanks for reading!

Ten reasons why you should download and learn to use Power BI Paginated Report Builder

Happy weekend all!

Yesterday was a big day for the Power BI team, as we released the first edition of Power BI Paginated Report Builder.  Why is this such a big deal?  Well, while Report Builder has been around for years, many Power BI users have not only never used the product, they’ve never tried to build a paginated report, period.  Now they can do just that, and I’m going to cover the top ten reasons why, if you use Power BI, you should download and learn to use Power BI Paginated Report Builder.

Download Power BI Paginated Report Builder

1. It’s Free.

It’s completely free to download and use.  Who doesn’t like free?

2. It doesn’t require Power BI Premium (or even Pro) to use it.

As many in the community know, Paginated Reports are available in Premium workspaces only (Here’s a link to up vote making this feature more widely available in Power BI – Paginated Reports in Pro and Premium).  However, just like Power BI Desktop, there’s no Power BI license required to use it locally.  So not only can you author reports, you can render and view them like you would in the service.  Take a look at the sample report Paginated Report Bear created back in November in the tool –

image

I have a similar experience as I would as a consumer in Power BI, including several key items I’ll cover shortly.

3. You can use it to connect to any Power BI dataset in Premium to build reports

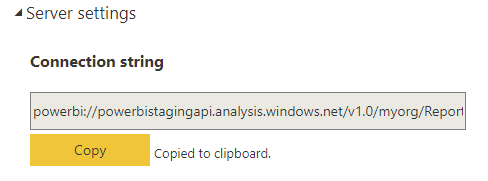
As my colleague Christian Wade announced last week, you can now use the XMLA endpoint to access your Power BI datasets in Premium.  Paginated Report Builder supports this connectivity option as well, and it’s super easy to do.  Simply copy the connection string from the “Settings” tab of your dataset in the Power BI service –

image

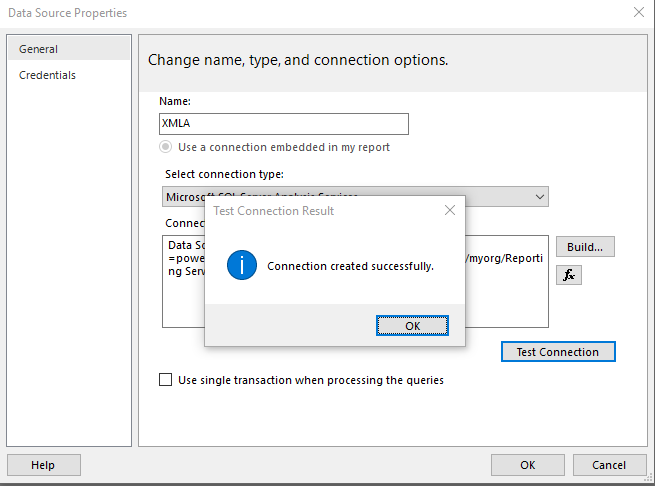
Then create a new “SQL Server Analysis Services” data source in Power BI Report Builder.  Type the phrase “Data Source =” in the Connection string dialog, paste the copied string from Power BI in there and hit “Test Connection”.  You’ll be asked to sign into Power BI, and assuming you’ve followed these simple steps, it’ll connect successfully and you can start building paginated reports with it!

image

4. You can connect to any Power BI dataset via XMLA, even if that capacity or workspace doesn’t also support Paginated Reports

While Paginated Reports are only available in a P1 SKU and above (or A4 SKU and above), the XMLA endpoint is available in every SKU, including down to A1 or EM1.  So you can create and use Power BI datasets from any workspace that supports the XMLA endpoint when authoring your reports.  The only restriction is that when we support publishing reports with Power BI datasets to the service later this month, you just need to publish it back to a workspace that does support Paginated Reports.  Don’t worry that your dataset might be sitting in a different capacity or workspace – we’ll explain more when we announce support in the official blogpost.

5. With the ability to use the same Power BI datasets used for your interactive reports, you can easily create basic paginated reports for scenarios as simple as exporting tables of data, or a print-friendly view of your Power BI Desktop report.

I’ll be the first to admit many things in Paginated Report Builder are harder for report authors to achieve than they are in Power BI Desktop.  But for many basic scenarios, like creating a simple table I know users will want to export out large amount of data from, Paginated Report Builder makes that very, very simple and is often times a better option.  I’ll have a walk through in a follow-up post where I can show you how to do either of these scenarios with your Power BI datasets, in some cases in a matter of minutes.

6. Paginated Reports published back to Power BI don’t have any data export limitations

I covered this in an earlier blogpost – Yes, you can export unlimited** rows of data from Paginated Reports in Power BI, but if your organization has Premium workspaces that support Paginated Reports, this is worth keeping in mind.  Now that you can create paginated reports against your datasets in Power BI Premium, having a simple paginated report for export scenarios might help unlock certain scenarios you couldn’t before for your users.

7. You can print your reports right from Paginated Report Builder

You probably noticed in the earlier screenshot there was a print option for a report you’re viewing in the tool.  You weren’t imaging it – you can print out your report right from the toolbar, and can even look at a Print Layout view of your report while interacting with it.  This option isn’t even available in SQL Server Reporting Services (!), and is a great way to see how your report will look once you do print it out.

image

8. You can export your report from Paginated Report Builder to several different formats, including PDF, Word, Excel and PowerPoint.

In addition to the ability to Print, you can also export to several different formats right from the toolbar when viewing your report.  This is a powerful capability that few tools have in their authoring environment right out of the box.

9. In a future update, we’ll have support to connect to Power BI datasets in non-Premium workspaces when authoring reports. 

This will make this even more of a no-brainer, as it’ll open up all the scenarios we’ve discussed in this post to any Power BI dataset.  Look for more details on this in the coming weeks.

10. There’s a lot of material to help you get started

A great place to start is with Patrick LeBlanc from the Guy in a Cube channel, who I work closely with.  He has put together several videos around Paginated Reports to help get you going.  Additionally, you should see several more in the coming weeks as more and more functionality is announced, plus the blog posts I’ll be adding as well.  I’ve added the playlist from YouTube below.

Paginated Reports playlist

I could keep going, but ten feels like a good place to stop on a lazy Saturday.  If you’ve never tried paginated reports before, now is your chance!  Go download Power BI Paginated Report Builder today and learn what all the fuss is about.

Thanks for reading!

Yes, you can export unlimited** rows of data from Paginated Reports in Power BI

image

This question has come up more than I can count, so I am doing a super quick blog post to answer it for folks.

Many people are well aware of the limitations around exporting data in Power BI today.  The biggest one I hear about is you can’t export more than 150,000 rows to Excel from a Power BI Report visual.  Since people always want to export data, the question came to me immediately when we released the paginated report capabilities in Power BI if we had the same restriction.  I know from several customers I’ve worked with in the past that many of their SSRS reports are/were nothing more than a single table with some parameters that users visit to dump out the data they need to an Excel or CSV file, so I wasn’t that surprised it came up.

The answer is no, we don’t put any cap on the number of rows you can export from a paginated report in Power BI to Excel, CSV, or any of the formats we support.  The only limitation is the amount of memory that’s available for Paginated Reports in your Premium capacity.  Hence the asterisk in the blog title – eventually you’ll run out of memory if you try to export too much at one time, so if you try to export a table of 1 trillion rows and 40 columns to a CSV file, I’m fairly sure you’re out of luck and will fail.  But as you can see by the picture, I exported one of my reports with over 240,000 rows out to a CSV file without a hitch.

There’s much, much more you can do with Paginated Reports in Power BI (and Patrick LeBlanc has done some awesome videos about a number of those items on the Guy in a Cube YouTube channel), but for those folks who want to use paginated reports to help them with this use case, you absolutely can do so.

Thanks for reading!