An Exclusive Interview with Paginated Report Bear: The Fun Side of Reporting

Introduction

In the world of data analysis and reporting, we often get caught up in the technical aspects and overlook the fun side of things. Today, we’re excited to share an exclusive, light-hearted interview with the internet’s favorite data reporting mascot, Paginated Report Bear! Join us as we delve into the bear’s thoughts on paginated reports, Power BI, and what makes him so passionate about reporting.

The Interview

Me: Thank you for joining us today, Paginated Report Bear! Let’s start with the basics. How did you become so passionate about paginated reports?

Paginated Report Bear: Well, it all started when I stumbled upon a beautifully crafted paginated report in the woods. The way it presented the data in such a precise, pixel-perfect manner was mesmerizing. From that moment on, I knew I had found my true calling – to spread the joy of paginated reports to the world!

Me: That’s quite an inspiring story! What do you think makes paginated reports so special compared to other reporting formats?

Paginated Report Bear: Paginated reports are like a canvas for data. They allow you to design highly customizable, print-ready reports that can span multiple pages with ease. Plus, they’re perfect for handling complex data scenarios, and who doesn’t love the satisfying feeling of flipping through a beautifully formatted, multi-page report?

Me: So true! Now, we know you’re a big fan of Power BI. Can you tell us about your favorite features in Power BI for creating paginated reports?

Paginated Report Bear: Absolutely! I love how Power BI offers a seamless experience for designing paginated reports using the Power BI Report Builder. It’s packed with awesome features like Document Maps, Interactive Sorting, and Custom Pagination, which make it super easy to create dynamic, user-friendly reports. And let’s not forget the amazing Power BI community that’s always there to help and share their knowledge.

Me: You’ve definitely become an icon in the Power BI community. How does it feel to be such a beloved figure?

Paginated Report Bear: Oh, it’s truly humbling! I’m just a bear who loves paginated reports, and the fact that I can bring a smile to people’s faces while they’re working on their reports is simply heartwarming. I’m grateful for the opportunity to connect with the community and share my passion for paginated reports with everyone.

Me: Before we wrap up, do you have any tips or advice for Power BI users who are just starting to explore paginated reports?

Paginated Report Bear: Absolutely! First and foremost, don’t be afraid to experiment and try out different features – that’s how you’ll discover the true potential of paginated reports. Also, make use of the wealth of resources available online, such as tutorials, webinars, and blog posts, to enhance your skills. And remember, the Power BI community is always there to help, so don’t hesitate to ask questions and learn from fellow users. Most importantly, have fun with it!

Conclusion

We hope you enjoyed this lighthearted, exclusive interview with Paginated Report Bear! His passion for paginated reports and Power BI serves as a reminder that reporting and data analysis can be fun, engaging, and enjoyable. Keep experimenting, learning, and embracing the power of paginated reports – and don’t forget to have some fun along the way!

This blogpost was created with help from ChatGPT Pro.

Mastering Paginated Reports in Power BI: Tips and Tricks for Success

Power BI is a powerful tool that enables users to create interactive reports and visualizations to facilitate data-driven decision making. One of the key features of Power BI is the ability to create paginated reports. These reports, also known as ‘pixel-perfect’ or ‘SQL Server Reporting Services (SSRS) reports,’ provide a high level of control over report layout and formatting, making them perfect for generating invoices, official documents, or detailed data tables that need to span multiple pages.

In this blog post, we’ll explore several tips and tricks that will help you create professional and efficient paginated reports in Power BI.

  1. Plan your report layout

Before diving into Power BI, take a moment to plan your report layout. Consider the information you need to display and how it should be presented. This will ensure a more efficient design process and will help you avoid making unnecessary changes later on.

  1. Use Power BI Report Builder

To create paginated reports, you’ll need to use Power BI Report Builder. This standalone desktop application is specifically designed for creating paginated reports and provides a familiar SSRS environment. You can download the Power BI Report Builder from the Power BI website.

  1. Set up data sources and datasets

Once you’ve opened Power BI Report Builder, you’ll need to set up data sources and datasets. To do this, go to the “Report Data” window, right-click “Data Sources,” and click “Add Data Source.” After connecting to your data source, create a dataset by right-clicking “Datasets” and selecting “Add Dataset.” This process will allow you to access the data in your report.

  1. Use tables, matrices, and lists wisely

Paginated reports offer a variety of data regions, including tables, matrices, and lists. Each data region has its own unique capabilities:

  • Tables: Use tables for displaying data in a simple row and column format.
  • Matrices: Use matrices to show aggregate data, especially when you need to display row and column groupings.
  • Lists: Use lists to create free-form reports with varying data layouts.

Choose the appropriate data region based on your report’s requirements to ensure an efficient and organized layout.

  1. Leverage expressions for dynamic content

Expressions are a powerful way to create dynamic content in your paginated reports. You can use expressions to:

  • Concatenate fields
  • Format dates and numbers
  • Calculate totals and averages
  • Implement conditional formatting

Learn the basics of expression syntax and familiarize yourself with the available functions to unlock the full potential of your paginated reports.

  1. Utilize headers and footers

Headers and footers are essential for adding context and professionalism to your reports. Use them to display important information such as page numbers, report titles, and company logos. Headers and footers can also contain dynamic content using expressions, making them even more versatile.

  1. Manage page breaks and pagination

Controlling page breaks and pagination is crucial for ensuring a clean and well-organized report. Use the “Page Break” property in the properties window to control the placement of page breaks within your report. Additionally, you can use the “PrintOnFirstPage” and “PrintOnLastPage” properties to control the visibility of report items on the first and last pages.

  1. Preview and test your report

Always preview and test your report to ensure that it meets your requirements and displays correctly. This will help you identify any issues or discrepancies early in the design process, saving you time and effort in the long run.

Conclusion

Creating paginated reports in Power BI can be a rewarding experience when armed with the right knowledge and tools. By following the tips and tricks outlined in this blog post, you’ll be well on your way to mastering paginated reports and creating professional, efficient, and visually appealing documents. Remember to plan your layout, use the appropriate data regions, leverage expressions, and test your report thoroughly. By doing so, you’ll not only impress your colleagues and clients with your Power BI skills but also make data-driven decision-making more accessible and efficient for your organization. So, go ahead and unlock the full potential of Power BI paginated reports, and take your reporting capabilities to the next level!

This blogpost was generated by ChatGPT Pro as an experiment to see the level of quality it would generate.

Related reading

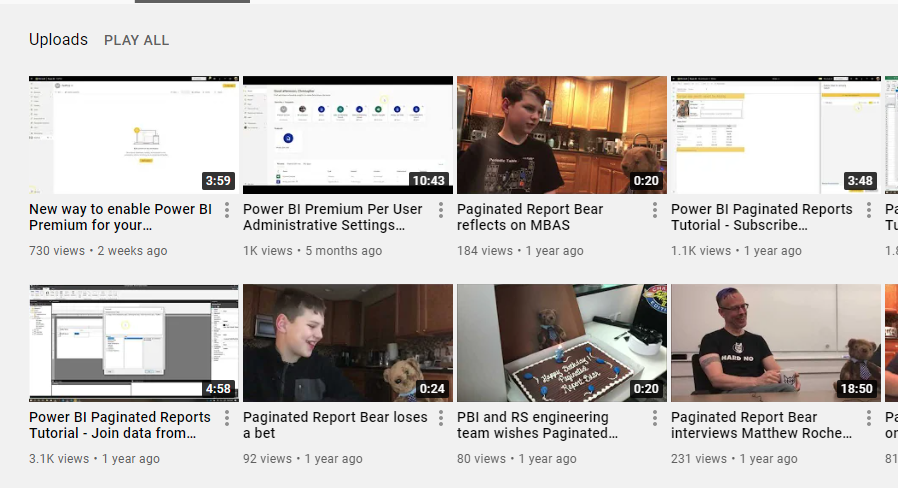
Be sure to check out my YouTube channel!

I know it’s been quite some time since I’ve posted on here, and while I hope to start to post more regularly here, you can always find me posting regularly on my YouTube channel. And by regularly I mean “More than once a year” :).

It’s focused on Power BI and paginated reports, along with some other neat items I’ll sometimes focus on (like Premium per user!).

Make sure you check it out if you haven’t had the chance to do so – Chris Finlan’s YouTube channel

Thanks for reading everyone!

Happy birthday, Paginated Report Bear!

20190606_022241354_iOSpadgie

Paginated Report Bear turns 1 year old today.  He wasn’t expected to last more than a few weeks.

20190405_043319215_iOS

For those of you who aren’t familiar with Paginated Report Bear, my friend Chris Webb described him as follows – “Well, he’s the breakout social media star of 2019, a furry YouTube sensation whose incisive interviews of members of the Power BI development team have become renowned for their deep technical content and insights into the Power BI roadmap. If you’re not watching his videos on YouTube, you’re missing out.”

20190609_152624000_iOS

If you watch the very first video that “Padgie” did 1 year ago today, Chris’s description seems EXTREMELY generous.  The production quality was very low, and Mr. Matthew (my son) couldn’t even say “Paginated Reports”.  Why even do videos with a bear in the first place?  You see, my son had for some time wanted to do a YouTube video series with me where his stuffed animals would be included.  They had been granted various personalities and voices throughout the years by yours truly, and these characteristics have carried over to the videos.  I decided to rename “Mickey” to “Paginated Report Bear” because he was the lovable but dumb one, and I thought the name sounded ridiculous.  And since my (naïve) assumption was we’d do a few of these videos during my vacation, and my son would get tired of doing them, that would be that.  And that almost happened – there wasn’t any videos for a month from December to January, and I figured that was the end of it.

20181127_162925342_iOS20190722_160008289_iOS

Then something strange happened – not only did my son want to do more, but some members of the Power BI community seemed to actually ENJOY the videos.  He was featured on Guy in a Cube, he was mentioned on the BiFocal podcast, and he was a hit at the MVP Conference in March (he even got an MVP pin!).  It was then that we decided to have him start interviewing members of the product team, starting with Lukasz back in April, and the rest is history.

20190609_212520198_iOS20190610_141332035_iOS

But the biggest achievement of Paginated Report Bear is the one he’s taught my kids as they’ve watched their dad carry a cheap stuffed bear purchased from EBay to conferences across the country just so people can take a selfie with him – you can do something different, or be different, and be successful in your career and in life.  That means a lot, and shows the broad Power BI community can have an impact outside of the day to day product details.

20190610_122939172_iOS20190610_194931190_iOS

So thank you, and I look forward to what the future has in store for Paginated Report Bear in the year ahead!

20190612_024209056_iOS20190703_173803591_iOS

Free sample Power BI paginated report – Ultimate Export Report available for download

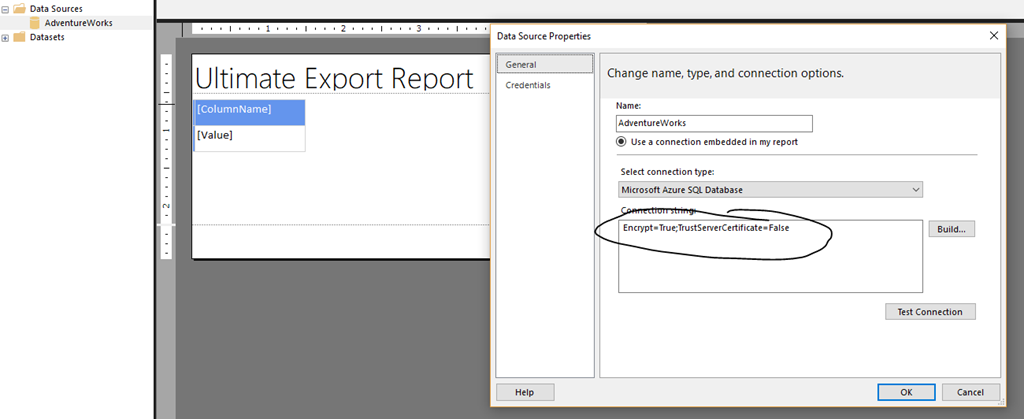
I recently came across an interesting article on MSSQLTips for SQL Server Reporting Services that showed how you could use a T-SQL query as the parameter value, and have it return a table of data as the result set from that query.  (The original article is here, and I will fully admit that all I did was take this author’s idea (and that of one of the commenters) and stick it into this sample report  – https://www.mssqltips.com/sqlservertip/5757/create-dynamic-ssrs-reports-using-a-query-as-an-input-parameter/ ). I wanted to see if this worked for Paginated Reports in Power BI, and of course it does!  So once I put in my connection string information for my Azure SQL database (the original article was against a traditional SQL Server database), I can write just about any select query against that database as a parameter at runtime and get back results in a nice table that can be exported out to Microsoft Excel.  I created a short video to show you how it works in practice –

Now there’s little chance I’d use this report as is in production – it’s really just a way for me to test some things, dump out data quickly, and it demos nicely.  But there are some ways you could potentially change this to make it more production friendly – have a list of dropdown values that represent the queries that you update on an ongoing basis, or even allow users to submit queries through a workflow you approve that updates the parameter list.

If you’d like to try it out yourself, feel free to download the sample report –

Ultimate Export Report

Once downloaded, you’ll need to update the data source with your connection string to whatever database you’ll use this against in Power BI Report Builder before you can use it in the service, but once you do that, you should be good to go.

image

Thanks for reading!

Use a Conditional Preview Image in Paginated Reports subscriptions in Power BI

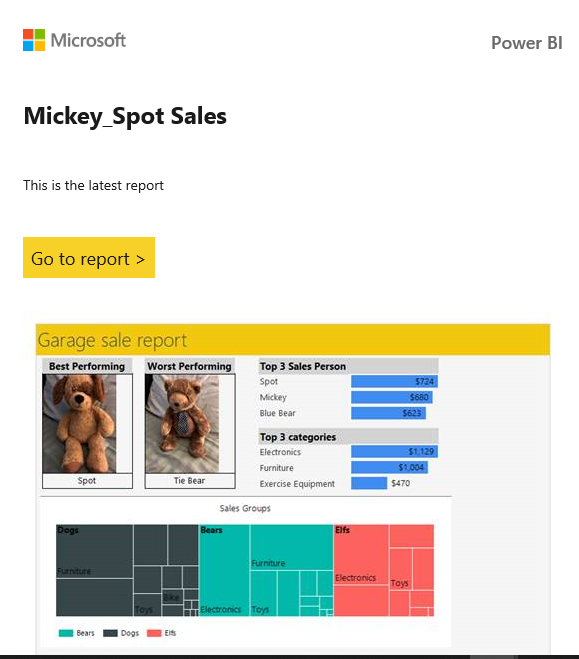
Recently in Power BI, a new feature was added for Paginated Reports e-mail subscriptions where you could optionally add a preview image in the body of your e-mail message.  By default, this is the first page of your report.  However, it doesn’t have to be.  For example, in my e-mail subscription, I see the following preview image –

image  

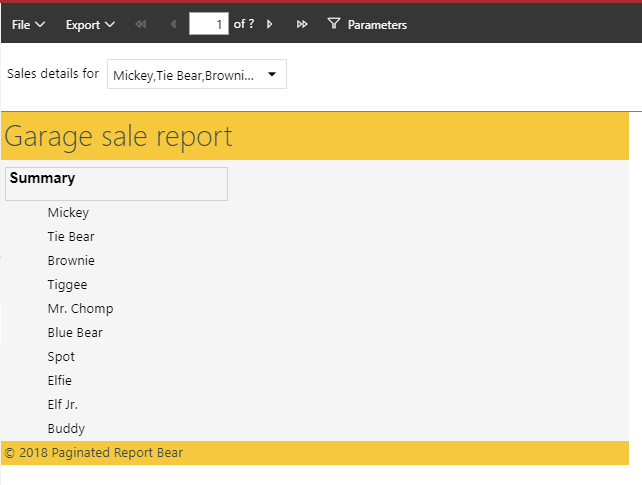
But when I view the report in the PDF attachment or in the web, I see the following report links as my first page –

image

How is this possible?

Well, one of the cool things you can do with Paginated Reports is set the visibility of items in your report to be conditional.  You do this by adding an expression that sets the condition for when it should be shown or hidden.  Since the preview image in your e-mail subscription uses the “IMAGE” output format, all I did was set the visibility of an item to be conditional based on that.  So I took all of the items you see in that preview image and added them to a tablix, then made that conditionally visible based on the following expression –
=ucase(Globals!RenderFormat.Name) <> “IMAGE”   

Now, the report renderer knows to hide that part of the report whenever the renderer is something other than the “IMAGE” output format.  I’ve attached the sample report below so you can try this out yourself.  You can test this in the Power BI service (if you have Premium) by setting up a new e-mail subscription with it, or in Power BI Report Builder by exporting it to a TIFF file.

Download Sample Report

Thanks for reading!