Drillthrough from one Datazen Map Dashboard to another dynamically

Tonight’s post came out of a conversation I had with my friend Chris here at Microsoft (yes, we’re both Chris).  I was looking to see if I could drillthrough from a map of the United States into each individual state, and see the county-level information of another Datazen dashboard.  The answer is – yes, kindof!

Why the caveat?  Because I want to dynamically have the state change based on which one I select for drillthrough.  You can’t do that by drilling from one dashboard to another inside the Datazen app.  But you can do it by using the web viewer functionality in Datazen for your lower level dashboard.  Let me show you what I did.

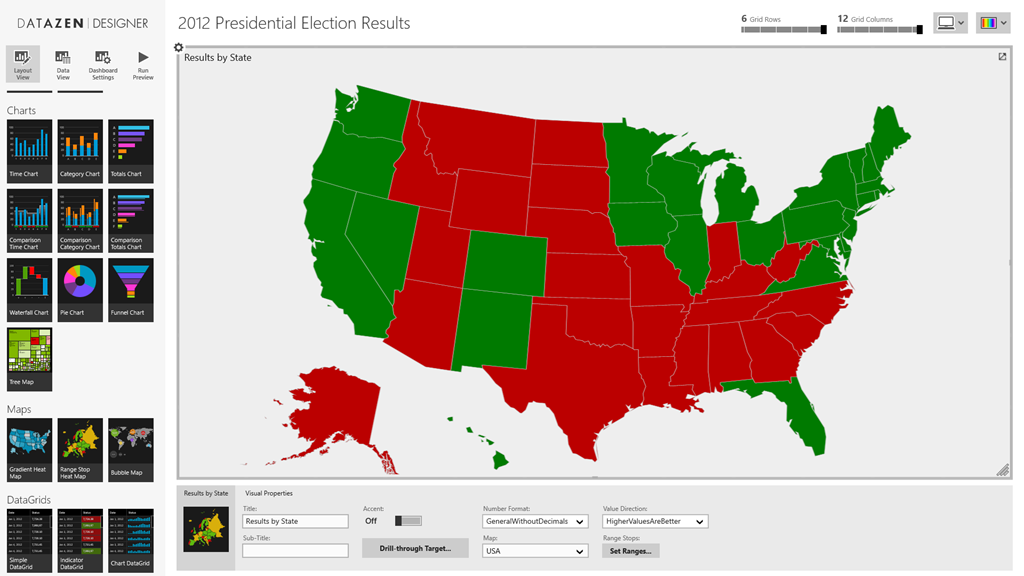
First, in the Datazen Designer, I dragged a single Range Stop Heat Map onto the canvas and renamed it accordingly.
DatazenMap

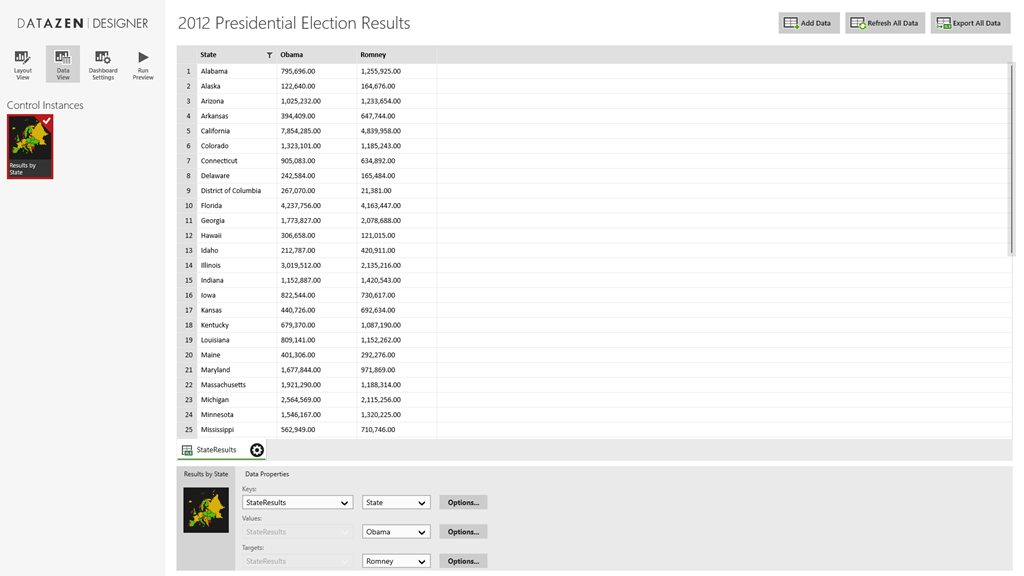
Next, I used Power Query in Excel to search online and find the state by state results for the 2012 Presidential Election.  I brought the results into an Excel file, and loaded the file into my Datazen dashboard under the “Data View” tab by choosing “Add Data” and “Local Excel File”.
Screenshot (27)
I made “Obama” the Values selection and “Romney” the Targets selection.  It doesn’t really matter which one you choose for which for this example, however.  Then I flipped back to my layout view.

I changed the range stop values to show a very narrow range for Neutral Start/Neutral End (99.98 and 99.99), so unless you had another Florida situation, you’d only see two colors for our map.  At this point, I saved it and created a new map dashboard.  But instead of using the out of the box maps, I loaded a new custom map from my local hard drive by choosing “Custom Map From File” from my map selection list.  Here I loaded the Pennsylvania map files I had (here they are if you would like to use them.  Just save them locally and extract them to somewhere on your machine – http://1drv.ms/1H1PtLp).

Screenshot (28)

Then I created a new map dashboard, doing all the same setup items I did for the map of the US.  I called it “Pennsylvania” and published it to my Datazen server.

I want everyone to see this dashboard, so I need to make it public, which is something that Datazen server supports.  To do that, I need to add a guest account to my Datazen server, and then give it rights to that dashboard.  So I add a guest Server User, like so –

image  Then I add Ol’ Guesty to my hub as a user –

image

Then I make sure I assign Sir Guest-A-Lot to my public dashboard (as you can tell, I’m kinda punchy right now).

image

Now I can link directly to this dashboard by using the following pattern as described in the Datazen documentation – http://local.server/viewer/public/dashboard?name=DashboardName. 

With that complete, I can go back to my original map dashboard and set up the drillthrough to the url of this state dashboard.  Since I want it to drillthrough to the selected state, and not just Pennsylvania, I’ll use the parameter value so my url looks like this –

http://sample.cloudapp.net/viewer/public/dashboard?name={{ RangeStopHeatMap3.SelectedItem }}

Now I publish my dashboard, and when I click on the state of Pennsylvania:
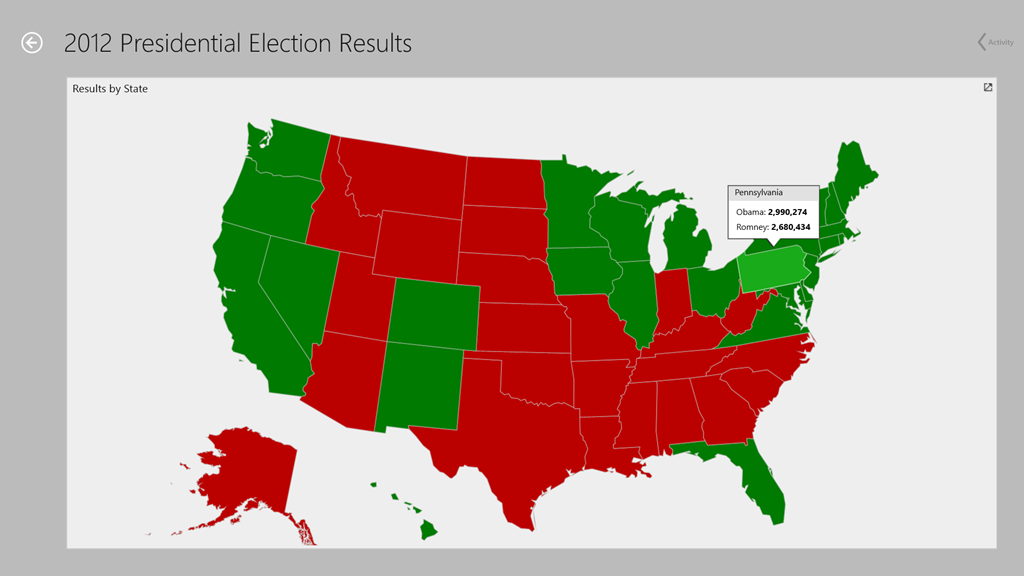
Screenshot (29)

A web browser opens up and I get this!
image

So yeah, there’s obviously the drawback I need to do this 50 times in this example.  But it DOES work (kindof), just like Chris and I discussed.

Thanks for reading!

How to drill-through from a Datazen dashboard to Power View in SharePoint

Welcome to the new blog home everyone!

So I’m assuming (perhaps incorrectly) most folks reading this know you can setup drill-through to a custom url in Datazen.  Usually, I talk to folks about it in the context of drilling through to a traditional SQL Server Reporting Services report, and I’m passing through some parameters I’ve selected on my Datazen dashboard.  But did you know you could also do something similar to a Power View report in SharePoint 2013?  Well you can!

First, you need to make sure you have Cumulative Update 4 for SQL Server 2012 SP1 applied in your SharePoint instance.  This update introduced the ability to use filters in a Power View URL.  The filters act as “pinned filters”, meaning they will apply to your entire report.  Assuming that is done, the process is fairly straightforward –

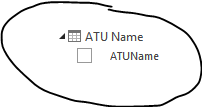
1.  You’ll need to create a Power View report in your SharePoint instance (you can get more information on that here).  You need to use the table name/field name of the parameter you want to pass-through as part of the url, so make sure you know both items.  For example, I used a field called ‘ATUName’ from a table called ‘ATU Name’ (quite clever, isn’t it?) for my example.

image

This translates to [ATU Name].[ATUName] when I’m creating my url.

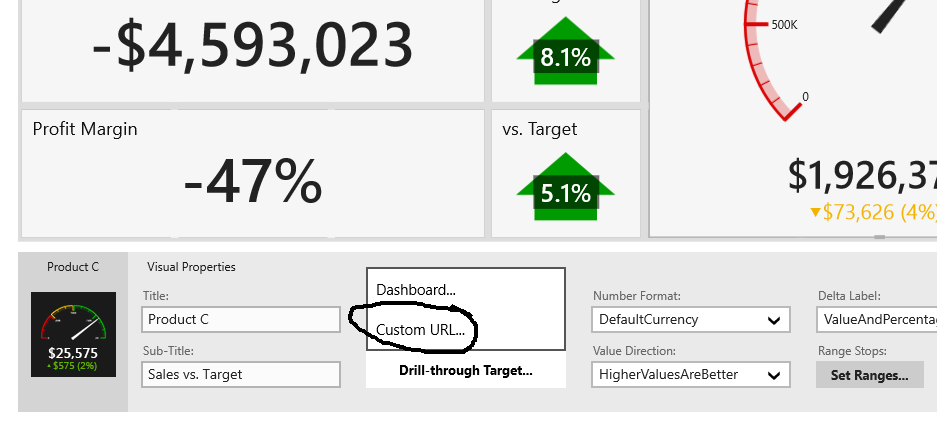
2.  Now that we have that setup, in the Datazen Publisher app, select an element that supports drill-through targets on the design surface. Open the Drill-through Target drop down in Visual Properties pane and select Custom URL, this will open the drill-through configuration dialog.

customurl

3.  Now I can enter my custom URL with the parameter I want to pass-through.  You have to make sure this typed out properly per the instructions in the blog post on using this functionality.  This includes the proper spacing and using the correct quote type properly.  See the example they give here –

image  

And then the end of my URL string –

urlcopy

Note that I included the space before and after ‘eq’.  You then also need to make sure you have quotes around the parameter you are passing through.

Now, you can’t test this working live in the development process.  You have to deploy the dashboard to the Datazen server, THEN you can test it.  An easy way to do that is from the web viewer.  If you login to your server in a web browser, you’ll see your dashboards listed like so –

image Select the dashboard you updated, and you’ll now see a little arrow on the widget you added the drill-through to Power View to.

image 

Make sure you’ve selected the value you setup as the parameter you’re passing through to the Power View report, then click the widget to jump to the Power View report.

image 

Your report will open with that parameter now pinned and applied to each part of the report!

image

This works from either the browser view of the Datazen dashboards, or from the Windows 8 apps, provided the web browser opens in desktop mode since the Power View report in SharePoint still renders in Silverlight.

Have a great weekend!