Articles

Datazen Friday Grab Bag Post – Windows 7, Support, Dashboard Staging, Training and a PASS tease

image

Happy Friday all!

I haven’t had a chance to post the last couple weeks, but with the PASS Summit coming next week, wanted to share a few quick items that have bubbled up, grab bag style!

Windows 7 Publisher now in GA – I know this is big news for a lot of folks.  If you’ve been using the preview version of this, make sure you download the updated app, which was made available earlier this week.

Where you can go for support – I’ve had this come up a few times recently.  You can send a request to support@datazen.com and you’ll get an auto-email response that will contain a number of FAQ’s and a link to file a ticket with the support team.  If the FAQ doesn’t answer your question, make sure you use that link to submit your support question that you get back in the e-mail.  I’d also suggest you link to the Datazen content portal, which has articles that apply to the vast majority of questions that come up.

Moving content between server/hubs – The topic of dev or staging environments for Datazen is one that people send me questions around.  The best way to handle this type of scenario right now is to create groups on the same hub for each staging area, and move the dashboards between those environments.  You can use the Datazen security options to hide the groups and dashboards as needed in each group, and you can change the groups you publish dashboards too, as long as they are in the same hub.  We’ve heard the feedback that people would like more robust options and will be looking to improve that experience as the product evolves moving forward.

Where can I get Datazen training? – For most folks, the tutorial videos posted on the Datazen site are more than sufficient to get started quickly and put together some amazing content.  If that’s not enough to meet your needs, I know some customers were looking at the course available from Blue Buffalo Press, as well as working with partners to help them meet their needs.

Is there a Datazen session at PASS next week?  Yes!  Paul Turley and I will be presenting at the PASS Summit – that’s the good news.  The bad news is, it’s in the last slot on Friday before Halloween.  So, I’m sure that will cut into attendance at least a little bit.  But for those who do stick around, I’ll promise you this – you’ll get a glimpse of Datazen vNext during the session!

Hope you have a great weekend, and I’m looking forward to meeting some folks at PASS next week!

Mini Post – Datazen Sample Brand Package

Yesterday on Twitter, there was a conversation around getting a sample Datazen brand package to use or look at.  I provided it yesterday in the context of that conversation, but happy to make it available here as well.  You can download it for your use from here – http://1drv.ms/1L4XptF

For more information about the Datazen brand packages, make sure you check out the official documentation.

Thanks!

Game Change – Part 3 of the Power BI and Office 365 Powerful Productivity Series

image
What happened this week may go down as one of, if not the most, important weeks in the history of Microsoft Business Intelligence.  Melodramatic nonsense from a Microsoft fanboy/employee?  Hmm – maybe.  Let me explain why I’m making this bold statement.

So, I’m not normal.  Neither are probably most (if not all) folks reading this blog.  That’s a good thing, because it makes us special.  We’re blessed with what Rob Collie refers to as the “Data Gene”, and it’s why we love working with the Microsoft stack.  It’s estimated (by Rob) that approximately 1 in 16 people have the data gene, in fact.  Which means 15 out of 16 people don’t have it.  They aren’t interested in crunching numbers all day, nor should they be.  It isn’t their job.  Which is why the presentation layer and integration with a productivity suite like Office is so important in any business intelligence solution – users need to be able to quickly and easily understand what’s being presented and take action on the information.  These are themes I discussed at length in Part 1 and Part 2 of this series.

When I joined Microsoft in 2013 in my pre-sales role, I quickly learned two things –

1. The vast majority of people I was presenting to weren’t the ones reading every blog post from Marco Russo or Jen Underwood.  They generally didn’t know or care what DAX was.

2. If they couldn’t see how they’d get business value from it personally, then they weren’t interested.  This doesn’t mean they’re selfish – on the contrary, it means they’re pragmatic.  And it is exactly how I’d feel if I was in their shoes.

Which meant if I spent a lot of time talking about how great the CALCULATE function was (and still is!) in Power Pivot, unless I had that one person in the room out of sixteen who had the data gene, I’d lost my entire audience right then and there.  Forget about the sales context – the reason I wanted to do that job was summed up nicely in this tweet I saw from Hope Foley the other day –
image
Yep, sounds corny, but it’s true.  And I knew I could help them solve their business challenges with our stack.  So I wanted to be sure to highlight functionality which THEY were telling me would help them the most, not just what I thought would.  Think back to the pre-Power BI era at Microsoft, which is when I joined – what two things do you think folks told me was the most valuable functionality I showed them?

1. The ability to export to PowerPoint from a Power View report in SharePoint was easily first
2. The decomposition tree in PerformancePoint in SharePoint was easily second

There wasn’t a close number three I could point to – at each customer presentation I did, if I showed these two pieces of functionality, they’d be the ones customers wanted to start using “tomorrow” because of the amount of value they thought it would bring their organizations.  What usually happened when I finished was, the customers marched right from the presentation down to IT and demanded they deploy the latest version of SharePoint and Office in the organization so they could use this functionality.  Naturally, IT said “Absolutely!  We own these licenses already and we’ve been itching to do this.  We’ll have you up and running in no time!”  Then they joined the rest of the Care Bears on Gumdrop Mountain to celebrate their good fortune.

I’m guessing you figured out I was being facetious.  For many customers, it was simply too much work for them to get all the pieces in place to take advantage of this functionality.  This was frustrating, but completely understandable coming from where I’d been in “shadow IT”.  So we only saw a fraction of the adoption you’d expect based on the interest shown in the presentation.  Fast forward to this week and what was announced.

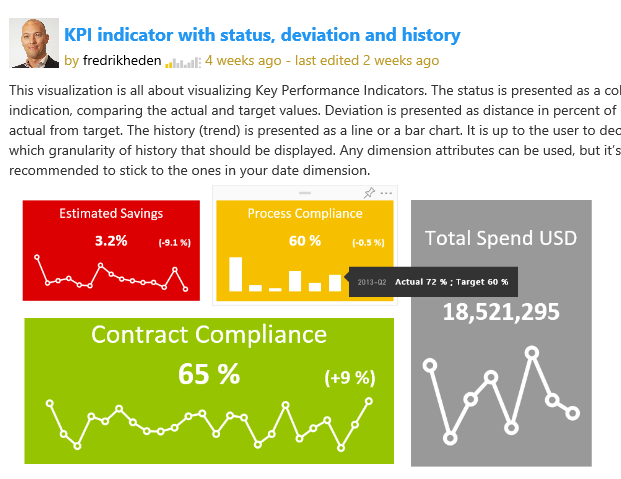
The first announcement came a week ago in the Power BI visualization contest.  Fredrik Hedenström submitted his second entry in the contest – now, it would be hard to top his first (which of course I loved – I am sure you can guess why looking at this picture of it)
image
Go Frederik Go!

But he may have done just that.  His entry this week was for a visual called Breakdown Trees.  When I saw it, I smiled.  Frederik basically took the decomposition tree from PerformancePoint and put it into PowerBI.

Power BI version
BT_Screendump1.png

PerformancePoint version

Remember, this was one of two things our largest customers told me they saw providing the most value to their organizations when I showed it to them.  And now, instead of just seeing it with AdventureWorks data being demoed, they could now be using this functionality, with their data, in the same meeting.  That’s absurd (in a good way)!

Maybe you’re thinking “Pfft – that was over two years ago.  I mean, Datazen didn’t even have an iOS app yet.  Times change, man!”

I seriously doubt that people won’t want this functionality as much now as they did then, but I’ll concede the point for the sake of argument.  The other announcement that came a few days later was even bigger than the first one.

image
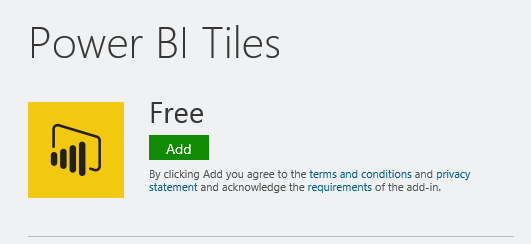
A company called DevScope created an Office Add-In that allows me to insert tiles from my Power BI dashboards into PowerPoint, Excel, or Access.  I’ve talked about Office Add-Ins before in a previous article, which was one of my most popular posts to date.  As I read through the blog post which showed me how to add the tiles, I thought to myself “It can’t possibly be this simple.”  So I tried it and followed the steps in the blog –

1. Insert the Power BI tiles in the document
image
image

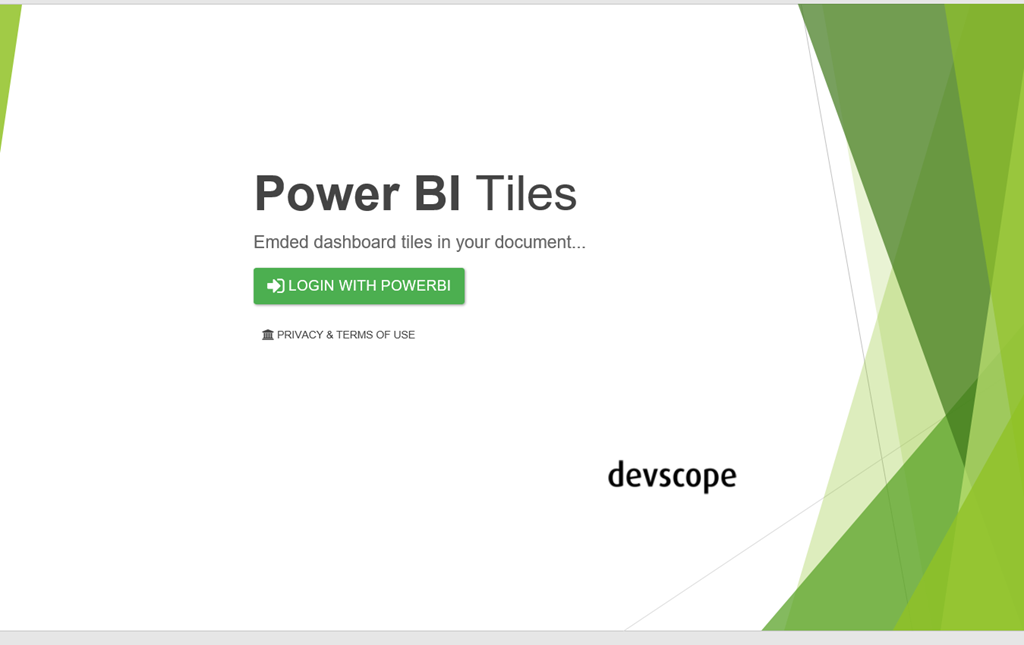
2. Click at the login button and authenticate with your Power BI credentials at the shown popup.

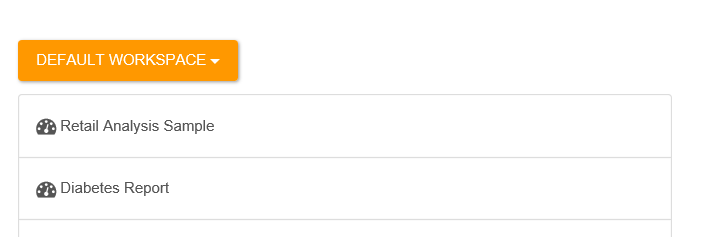
3. Select the Dashboard and the desired PowerBI tile:image

image

I now had two questions –

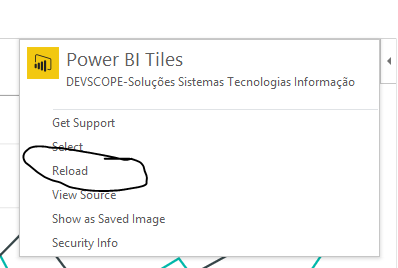
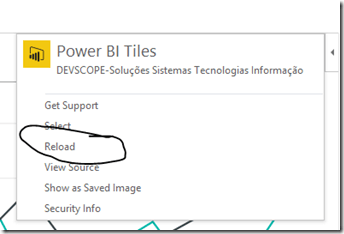
1. Can I refresh the data?  Yep
image

2. What if I send it to someone who doesn’t have the app?  You still can, just choose the “Show as Saved Image” option.
image

OMG – this changes everything.  Here’s why –

1. For two years, every organization I met with asked for this type of functionality in every meeting.  That’s over 100 of the largest Microsoft customers in the world.  Even after Power BI was introduced and became the focus of many of my conversations, they have the same ask.  The ability to get their live dashboards into PowerPoint slides OR line of business apps.

2. The level of difficulty to get this setup for an organization has gone from “complex” to “trivial” if they’re running a newer version of Office.  Many more customers are actively using Office 365 and 2013/2016 than were using it two and a half years ago, so that isn’t the barrier it once was.

3.  Well, what if an organization is instead using Office 2010 as the standard?  It used to be that would be an enormous blocker to even try Power BI.  Now, it doesn’t matter for Power BI, since I can sign up and use that immediately regardless of Office version.  But I wouldn’t be able to use the app, right?  Replay that fanciful conversation the folks had with IT earlier – instead of needing to have setup

– SharePoint 2013
– SQL Server
– SQL Server Analysis Services,
– SQL Server Reporting Services
– PowerPivot for SharePoint add-in
– Office 2013 for the client machine
– Hardware or VM’s to run everything on
– The Silverlight add-in on the client machine
– Proper security integration, proper licenses, stakeholder buy-in, etc.

to get functionality they saw me demonstrate, I just need one machine with an updated version of Office (32 or 64-bit) to get this functionality.  I can think of exactly two customers during my time in the field where they wouldn’t provision a single machine with the latest version of Office on it or allow the person to upgrade.  In general, it wasn’t a big deal to get a couple folks using a newer version of Office to prove out the value of the solution.  So I show them in the presentation they can do this.  Then they sign up and do it right away with their Salesforce.com data, and the only thing preventing them using it in every PowerPoint presentation they create is a slower deployment of Office?  That’s a much, much easier thing for them to get done, and I assure you, people will make the ask to do so just to get this.

4. This is the biggest one, and I am convinced of this – this functionality is so simple and so valuable, people will sign-up for Power BI to use this functionality even if they already own and use another tool.  Forget about how easy it was to do – as far as I know, NONE of the other major self-service BI vendors I just mentioned can do what I just did at all, let alone that easily with three major pillars of the productivity suite that people use every day.  It was that important to every business I’ve ever worked at, talked to, whatever.  And because I don’t need every user to have the app downloaded, (remember, it still allows them to see the data as a static picture if they open it and don’t have the app), I’d be giving this an AWFULLY long look if I’m currently taking 30 snapshots of my Tableau/Qlik/Lumira/Whatever report and pasting them into a PowerPoint deck every week.

It’s not a perfect app – yet.  If I have 50 tiles in my slide deck, yeah, refreshing each one at a time would get to be tedious (yet still much faster than my current option).  To paraphrase Voltaire, “Don’t let perfect get in the way of good.”  This app is really good as is, and it’s been available for all of two days.  The only folks who wouldn’t get any value from this are the ones who can’t take advantage of Power BI at all.  To them I say, read the latest blog post from my colleague Riccardo Muti this past week who shows off the newest functionality in SQL Server Reporting Services in SQL Server 2016 CTP 2.4, available now.

Yep, we added the ability to Export to PowerPoint there as well.  And it looks GREAT when you export the report, thanks to the other enhancements they’ve made.

So, what do you think?  Did Microsoft truly change the game this week?  Before you answer, go ask some non-BI pros if they’d find the functionality I just described to you something they’re looking to use in their jobs.  I think you may surprised just how valuable something so simple might turn out to be.

Enjoy your weekend!

Mini Post – How to build a Datazen PowerBI Mashup Dashboard

image

Mini post for you all today – Looking to show off your Power BI and Datazen dashboards in a single view?  A quick and easy way to do this is to take advantage of the capabilities to use custom URL’s from your Power BI tiles and link them to Datazen dashboards.  You can add images of your Datazen dashboards, then add a custom URL to the pinned image.  That way, when someone clicks the image, a new window opens showing your Datazen dashboard or KPI.  How did I generate the image files for the Datazen dashboards?  From my previous post!

Combine Excel Online and Load on Demand to power up your Excel data source in Datazen

image

I hadn’t planned on a post today, but after watching the Philadelphia Eagles get their first win of the season, I was inspired to do something I’d first thought about a couple weeks back.  Specifically, I wanted to use an Excel document as a data source in my Datazen dashboard, but enable Load on Demand capabilities so I could take advantage of parameters.  I also wanted to see how that would work in combination with people just typing in data into the Excel sheets that are the data source.  How quickly would I see their changes in my Datazen dashboard?

Out of the box, Datazen allows you to use Excel files in a shared folder as a real time data source.  And in the post I did around combining Datazen dashboards with Power BI Q&A functionality, I first talked using the sync capabilities of OneDrive to sync an Excel file from my local drive to the Datazen server.  The thought was, that way if I refresh a data source locally, I can have it sync up to the server.  The issue I saw with using this as the solution for this scenario were two-fold –

1. I was the only person updating information in this scenario.  Ideally multiple people could make updates using Excel Online at the same time.

2. I couldn’t do parameters with the out of the box Excel data source in Datazen.

Well, what if I used the workaround I mentioned about how you could use Excel files as a data source for KPI’s?  Since that had you using Excel like SQL, maybe then I could use parameters.  Let’s give this a shot.

In my Datazen server, I’m going to create a new data source called Excel as SQL, using the instructions from the blog post I referenced –
image  I’m going to create an Excel file with two tabs – one has Category, Amount and Target along with some sample data.
image
The other just has Category and a single sample value.
image
I then save my file.  It’s now available to me either on the server or in a web browser via Excel Online, thanks to OneDrive.
image

On the Datazen server, I’m going to create two SQL queries to use.  The first one, called Data, looks like this –
image

You see I’ve setup a parameter called @Product to use – here’s what that looks like
image

I used a default value to make sure I get back at least one value, otherwise the Datazen Publisher won’t be able to build the data view properly.  Next, I’ll build my other query called FilterValues.  It’s pretty basic –
image
Now I can build my dashboard.  I’ll bring in two elements – a Selection list and a Number with Delta.
imageThen bring in both of the data feeds and hookup the data to the dashboard elements.
image
I’ll setup my parameter to be equal to what’s passed into my dropdown list.
image
Now I publish my dashboard.  When I hit it from a web browser or app, I get back what I’d expect to.
image
This is fine, but I’ll want to add more items on an ongoing basis.  If I try to open the document and make the changes directly on my desktop, the data source is locked and not available to Datazen –
image
But, if I instead make the changes in Excel Online, the changes get synced and my data source isn’t locked!  This is true even if I have multiple people adding items at the same time.  I’m going to update my Excel Online document by adding a number of new categories (as suggested by my children) –
image
How quickly these show up can vary – I’ve had it in as little as 5 seconds, and sometimes it’ll take up to a minute.  For example, these showed up by the time I finished typing the previous sentence.
image
And I’ll now update my data in the other sheet as well.
image
What’s cool here is I don’t need to refresh the page to see this new data, since it’s always going to back to the original data source thanks to Load On Demand.  Once my data shows up, my values are automatically updated when I change the dropdown.
image And notice I added the Seahawks data – I’ll never see that as a value if unless I add it to the dropdown as well.

This offers some great flexibility for folks to manage data and make updates this way.  You could also do multi-select values vs. a single value by changing your SQL statement and allowing multi-select in your dropdown list.

Thanks for reading everyone!

Throwback Thursday Fun – Use a Visual Studio LightSwitch App to enable search/auto-complete for large selection lists in Datazen

image

This is an admittedly goofy post, but maybe it points some folks in the right direction.  One question that comes up is around how can you better manage a large lookup list in Datazen.  Currently, the product doesn’t allow search functionality in the dropdown list.  There is a way to work around this, however.  Previously, I posted about how to set default selection values in Datazen dashboards viewed in a browser.  The next logical step here would be to build a custom app and pass the values to that url.  I did just that, and I built the app in Silverlight!

Why did I do it in Silverlight?  Well, I  figured for Throwback Thursday (and because it’s admittedly a hacky solution) I’d kick it old school and build a C# LightSwitch app.  And since I realize most folks aren’t looking to do Silverlight development these days, I won’t bore you with the normal code review and walkthrough.  Instead, I decided to post the app I threw together up in Azure so you can play around with it and see if inspires you (or makes you smile.  or weep).  Here’s what you do to give it a whirl –

1. Go to https://datazentbtapp.azurewebsites.net/desktopclient where you’ll be prompted to install the app locally on your machine.  There’s no security on it or anything (and I didn’t bother signing the .xap file).
image

2. You’ll see the little DatazenTBTApp logo on your desktop if you choose that option.  Double-click on it to open the desktop app.
image
3.  The app will open and you’ll see the only screen in the app –
image
4.  The dropdown list on the left contains over 2500 records to choose from, so it’s not something you can easily scroll through.  No problem – just type the first few letters in the auto-complete combobox in the app.  You’ll jump to the results that match what you’re typing.  I’ll start by typing “MGS” – I quickly jump to the matching results that start with MGS, and my dashboard updates automatically to give me the proper result –
image

That’s basically it – feel free to try typing in some different letters/words (obviously Fabrikam and Contoso are well represented in this product list), watch your dashboard update, and relive the magical year of 2010!

(And yes, I might do one in HTML5/JavaScript in a follow-up post sometime.)