Articles

Render unto Datazen – a solution for rendering issues

In the latest server build (which I spoke about here last week), some users were running into issues with the Datazen rendering service.  In plain English, it just means they weren’t seeing their dashboard thumbnails properly in the web browser or client apps.  We’ll be tweaking the server install slightly to make sure this doesn’t occur for anyone, but if you have an issue prior to that being updated, there is a simple fix for this.

In your Datazen server file explorer, navigate to the following folder –

C:\Program Files\Datazen Enterprise Server\renderer\svc

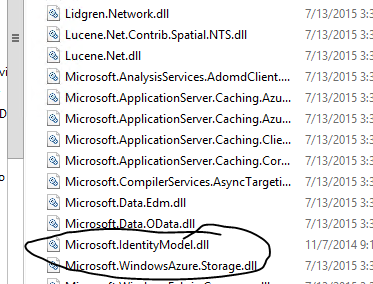
Copy the ‘Microsoft.IdentityModel.dll’ file –
image
Paste it into the following folder –

C:\Program Files\Datazen Enterprise Server\renderer\viewer

You can then restart the Datazen Server rendering service on your server –

image
And your days of rendering issues should be over (if you were having any to begin with, that is).

New Datazen Server Build Brings some MDX Magic

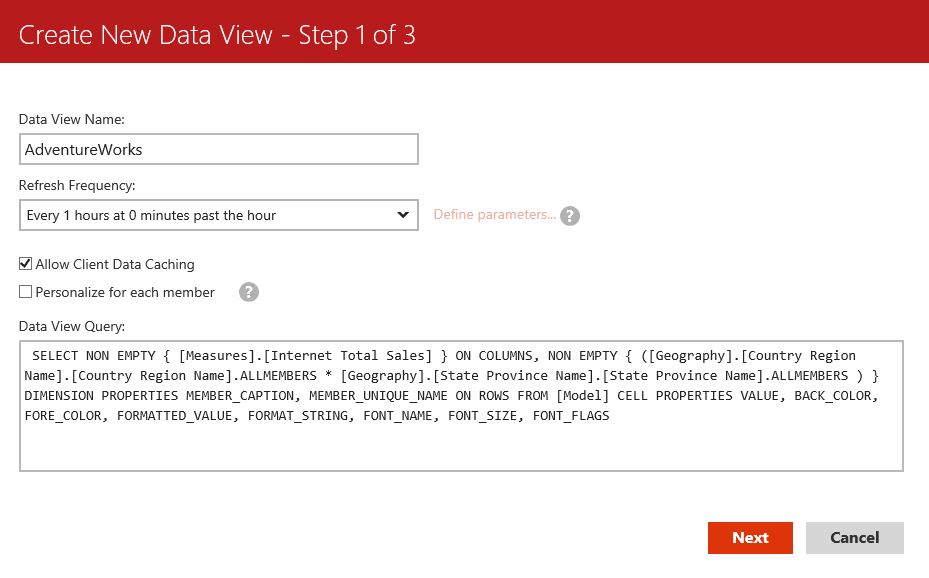
Oh, how I’ve waited for this day.  Finally, the days of handwriting MDX queries in Datazen server are over for me.  Thanks to the latest server update, the server can now handle MDX generated from a tool like SQL Server Management Studio or SQL Server Report Builder.  Not only that, I have additional control over the field names and field types when the query results are returned.  Let me show you how it works using SSMS – Right-Click on your database and select browse – image The handy Model browser comes up where I can drag and drop my fields from my model and build my query. image I’ll bring in Country Region Name and State Province Name from Geography plus Internet Total Sales from my Measures.  My results are returned like so – image Now I want to get the query that generated by this to use with Datazen.  I can simply toggle off Design mode by clicking this button in the toolbar – image And my query text appears – image I’m going to copy this text and switch over to my Datazen control panel and paste this query as a new data view under my SSAS data source – image Before today’s update, when I hit next, this query wouldn’t work.  It would just bring back a blank result set.  But now, a couple things now happen.  The first one is, a new screen appears in the wizard – image I now have the ability to change the display name, the data types being returned from the data source, and exclude certain fields from the result set.  This gives me a lot of flexibility I didn’t have previously.  So I’ll change my display name to the following – image I hit next and Whammo (that was for Mike Gannotti) – the query not only works, it is all cleaned up and ready for my Datazen dashboards – image This is great news for folks who love Datazen, but don’t love handwriting their MDX queries.  And the new abilities to change the display name, data type and field list is there for all datasets, not just SSAS.  So SQL Server customers, grab the new server build of Datazen and take advantage of this great new functionality. Thanks for reading!

Combine Datazen dashboards with Power BI Q&A functionality

Happy Friday, everyone!

Did you know that Power BI now allows you to directly link to individual dashboards?  This got me thinking – I love the Q&A functionality in Power BI.  Could I easily put together a solution where I used Datazen for my dashboards and jumped into the Power BI service to ask additional questions?  Why yes, yes I can.  Here’s how –

For this example, we’ll use a simple Excel workbook as the data source.  But let’s leverage the capabilities of OneDrive for Business to make this solution a bit more elegant.

image

Why?  Couple reasons –

1. Power BI will automatically refresh datasets sitting in OneDrive every hour, so anytime you update your Excel data, it’ll get grabbed automatically by Power BI shortly thereafter.

2. You can leverage the OneDrive for Business sync client to save Excel files locally on your PC and have them automatically sync to other machines running the sync client.  This makes it easy to get my Excel files onto my Datazen server after I’ve installed my sync client on there – I can refresh my files locally, save them to my OneDrive folder on my PC, and they’ll show up on the Datazen server within minutes!  I could even use a tool like Power Update to automate the data refresh of my Excel files.

Let’s get started –

First, I’m going to open Datazen and draw my dashboard first so I know how I should lay out the data in my Excel workbook.

Screenshot (34)
With that done, I’m going to create my workbook from my live data source using Power Query to make sure it’s laid out the way I need.
image
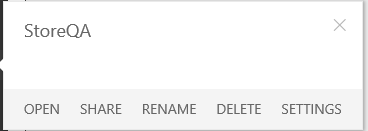
Now, I’m going to save the file to OneDrive for Business.  Once that’s done, I’m going to my PowerBI.com site and creating a new dashboard called “StoreQA”.
image
Now, I’m going to add my data to the dashboard.  So I click “Get Data”
image
Then I select “Files”
image
Now I want to select the “OneDrive for Business” tile
image
And then find the file I just saved

image
and hit “Connect”.  It’ll then bring my data into the dashboard and I can leverage Q&A with it.
image
I’m going to leave this open for now, and jump back to my Datazen Publisher App to bring in the Excel data to my Datazen dashboard.  You’ll need to setup the OneDrive for Business folder on your Datazen server as the location for the Excel data (this assumes you setup the sync agent on the box already).

image

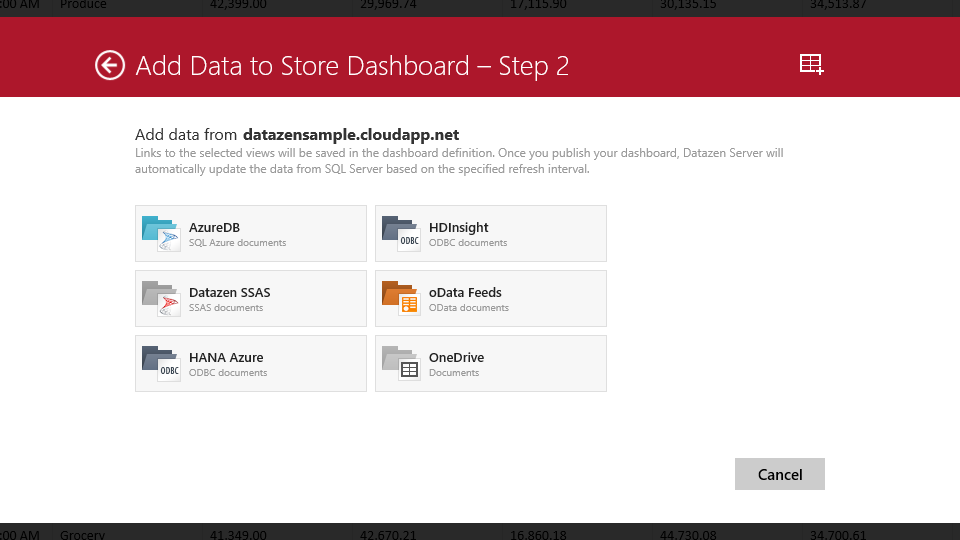
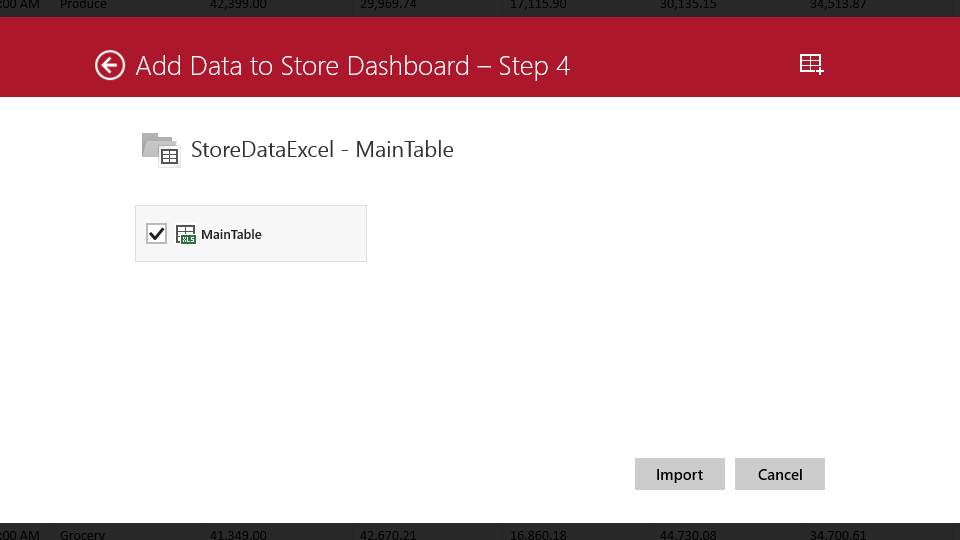
With that done, you can bring in the Excel data to your Datazen dashboard
Screenshot (35)
 Screenshot (36)
and hook back in the elements accordingly.

Screenshot (39)

Once that is done, you’ll want to create a link from the Datazen dashboard to the Q&A in Power BI for this dataset.  Go back to your browser and grab the URL for the dashboard from the address bar.  It’ll look like the example here – https://app.powerbi.com/dashboards/xxxx

To go directly to the Q&A functionality for this dashboard, just add ‘/qna’ at the end of the url, so it then looks like this – https://app.powerbi.com/dashboards/xxxx/qna
You can test it out and see how it takes you right to the question and answer area for this dashboard –
image
Simply copy that link and select an element on your dashboard you’d like to link to the Q&A piece from
image
by using the Drill-Through Target functionality to point to a custom URL
Screenshot (37)
Now when I click on the element, I get right to the Q&A page in Power BI with the same dataset so I can ask it more questions about my data
image
If you really wanted to get clever, you could even use the parameter functionality.  See how when I ask a question in Power BI, the URL changes to include the question text –

https://app.powerbi.com/dashboards/f31f7d2f-13ba-4e21-8b22-754ac62d39d7/qna?q=what%20were%20total%20sales%20for%20grocery%20by%20year

and gives me the following result

image

I can simply change it to use a parameter instead, so it would look like this –

https://app.powerbi.com/dashboards/f31f7d2f-13ba-4e21-8b22-754ac62d39d7/qna?q=what%20were%20total%20sales%20for%20{{ SelectionList01.SelectedItem }}%20by%20year

and when I run my dashboard, I can change the dropdown
Screenshot (38)

and the question will dynamically change when I click on my element with the link to Power BI!

image
Remember, you have to publish the dashboard to your server before you can test the URL drillthrough in Datazen!

And with Power BI now having the ability to setup custom links with it’s elements, you could even pin the tile for the question you just asked so you could jump back to your Datazen dashboard!

image 
Hopefully this helped open up a number of possibilities with the tools for you to explore.  Have a great weekend, and don’t forget to download the Windows 7 publisher app currently in preview from here and give it a spin.

Thanks for reading!

Extraordinary Things

Welcome back!

Before I jump into the meat of the post, a quick note of interest to many of you – the Windows 7 Publisher App from Datazen is now available for public preview.  You can download it and try it out today at this link – http://www.datazen.com/start

This post is a little different than the previous posts on this blog.  I’m writing this in the Microsoft office in Malvern on a rainy Saturday.  It’s the last time I’ll sit in this office in my role as a Technology Solutions Professional for the Mid-Atlantic.  I truly loved this job, and the coworkers and customers I got to meet and work with these last couple years made it a truly special place and time in my career.

But why am I leaving a role I so enjoyed?  It can be traced back to an hour-long meeting I had when I was still at SAP in April 2013.  That was the day I first met with the team from Datazen.  Not sure why I saved a copy of this appointment, but I’m glad did.
DatazenImg
From that day until now, I have worked very closely with them, and in my role here at Microsoft, I watched customer after customer smile from ear to ear when I’ve shown them Datazen.  And when the opportunity to work with them and the rest of the Power BI team presented itself,  I jumped at the chance to work with such a talented and passionate group of individuals.  And that’s why I’m at the office on a Saturday – I’m waiting for prospective home buyers to finish looking through my house, since I’m headed to the Redmond campus starting this summer.

One of my favorite motivational speeches was one that Jim Valvano gave in 1987 to the Million Dollar Round Table.  This particular section is my favorite –

I get pumped up every time I watch that clip, because it speaks perfectly to how I try to do my job, as I’m sure it does for a lot of people reading this.  I consider myself one of the ordinary people he speaks about, who has accomplished some extraordinary things thanks in large part to Microsoft’s tools and technology, from LightSwitch to Power BI to Datazen.  And I’ve seen that same thing happen at customer after customer during my time here.  I’m thrilled to be joining the team and working with all of you to continue that proud tradition going forward.  And I’m also excited to get back in my house – I’m dying to take a nap.  Smile 

Thanks for reading!

How to enable user activity reporting on your Datazen dashboards

One of the common questions that has come up around Datazen is folks wanting to see some basic information around their dashboard usage.  While there isn’t anything like that available on Datazen server right now, there is a way you can setup the collection of some simple metrics on each dashboard.  Let’s walk through how you do it.

You’ll need to setup a table on a SQL Server instance (or Azure SQL Database is a great option, and what we used for this example) to collect the metrics.  The table will have just a few fields – ActivityId, ActivityDate, ActivityDashboard, and ActivityUserName (I’ll provide the SQL scripts I used for this as part of a zip file you can download at the end of this post).

image

Once you’ve created the table, you need a way to insert the data coming in from your Datazen dashboards.  We’ll use a simple stored procedure that runs each time someone opens a dashboard.  You need to make sure the procedure also includes a simple select statement after your stored procedure executes.  I’ll explain why in a little bit –

image

Once that’s done, switch over to your Datazen server instance and add this SQL instance as a new data source.

image

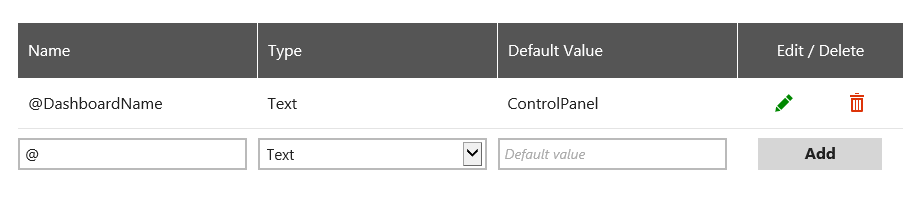
Here’s where the magic happens – you’ll want to add the stored procedure as a query, and this needs to be a real-time data connection.  You’ll also need to make sure you are passing through the parameters from Datazen that you need to capture.  So you’ll first add a new parameter from the ‘Define Parameters’ link highlighted here –
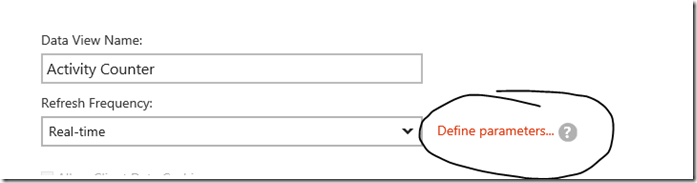
imageSetup a parameter for your Dashboard Name and assign a default value that will appear when a user is entering the dashboard design screen for that dashboard.  This allows you to determine who might have made changes to a dashboard, for example.  Here’s what I chose –

image
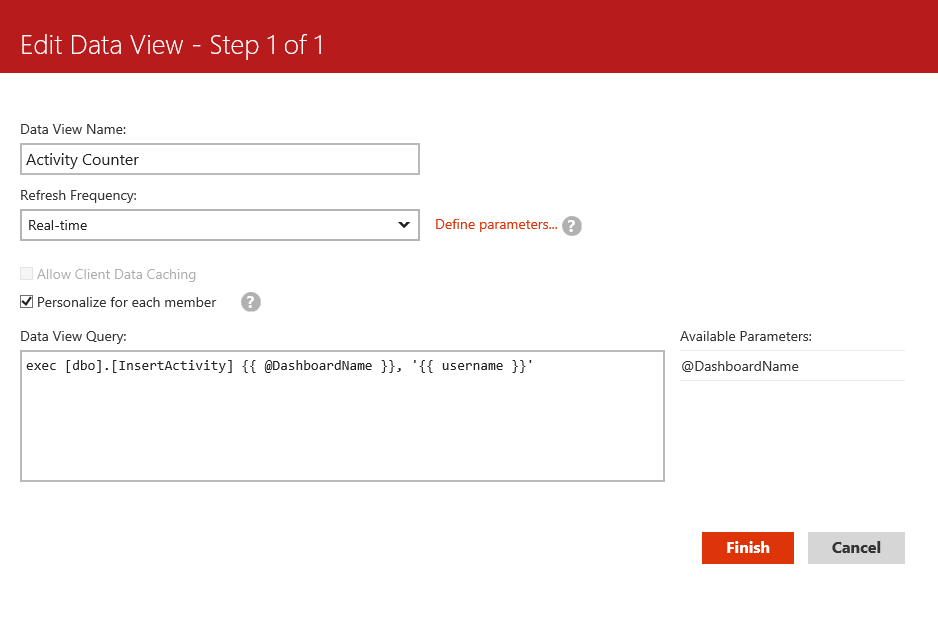
Once complete, I’ll now enter my query text and make sure I’ve checked the ‘Personalize for each member’ option.  This will give me the ability to capture the username for each user and pass that as a parameter.  Here’s my final result –

image
Notice I added single quotation marks around the username parameter, and also used curly brackets around each parameter I am passing back to the stored procedure.  It won’t work properly if you don’t do that.

I hit finish to save this information, and I now have the following in my list of data queries.  It was successfully setup, but I don’t have the ability to preview the data like I do with other queries I’ve created.  That’s okay, as long as you have the successful status message like I’ve highlighted here. 

image

To test this out, I go into my Datazen publisher app and create a brand new dashboard with a single widget.  It doesn’t matter which one, be creative!

Screenshot (30)

Once complete, you now can add the data source you created earlier to the dashboard.  Here’s where you see the results of the query that runs in the stored procedure.  Datazen has to have a result set returned for the data view to be added to the dashboard, which is why we had to have the query included  –

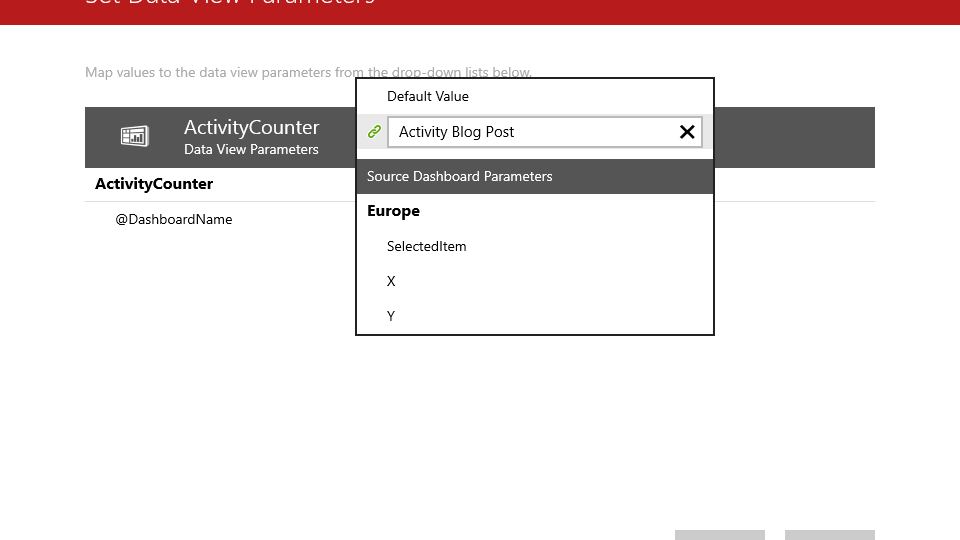
Screenshot (31)To make sure you properly now capture the dashboard name, you need to click the Param. selection under the gear in the data source tab to bring up the selection screen.

Screenshot (32)

Then type in the dashboard name as the default value that gets passed back to the SQL table.
Screenshot (33)
Hit Apply and run a preview of your dashboard.  If you check your table in SQL Server, you’ll see the resulting record has been inserted into the table.

image
You notice you don’t need to hook it into any of your dashboard widgets for this to work, and this will work for any dashboard you setup and publish to your Datazen server. 

Now you can view a simple report (maybe even in another Datazen dashboard!) that shows you the user activity for each of the dashboards you’ve added this data view to, including the time, username and dashboard name.  It also opens up a number of possibilities for you to fire off other events every time a user opens a dashboard that I’ll explore in future posts.

Here is a zipped file of the SQL scripts I used for this post – http://1drv.ms/1TbMVPN

Special thanks to Christopher Moncayo for his help with this post.
Shape of the Union or Free Datazen Maps!

This blog post will be short, but hopefully valuable for everyone.  I’ve included a link to a zip file at the end of this post containing all the US states and some variations on the continental US you might find valuable (4 region view, 9 region view, etc.)

It’s easy to add these to your server and make them available in your dashboards.  To do so, go to the Datazen hub you wish to add the new map shape to and click “Custom Maps” on the left-hand navigation bar –

image 
Then click “Upload Map Shape” to open a new dialog and select the files you wish to upload –

image
image
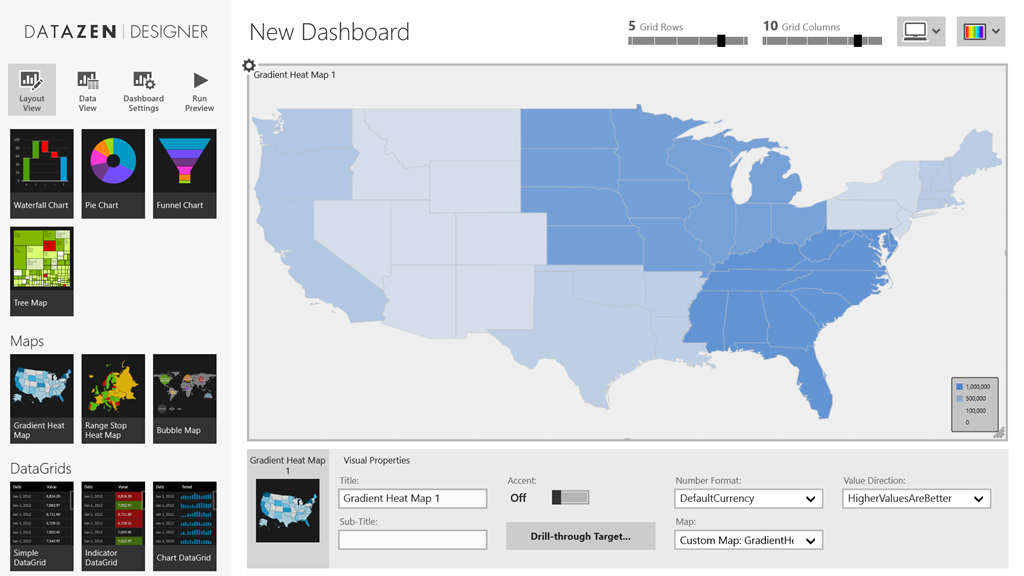
Once you’ve uploaded them, you’ll have access to them whenever you select any map object in your designer screen by selecting “Custom Map from Datazen Server” in the dropdown.  You’ll be prompted through a few screens to select the map you want to use.

Screenshot (1)

Screenshot (5)

Screenshot (3)

Screenshot (4)

Now you have your new map in your dashboard!

Here is a link to the files for you to download and use – http://1drv.ms/1FOAwXL

Enjoy!