Articles

How to use custom thumbnails with Mobile Reports in SQL Server 2016

Happy Sunday folks!

In the new Reporting Services web portal, you see thumbnails for each of the mobile reports you’ve published to the server.  Well, here’s a neat hack that allows you to update your mobile reports with custom thumbnails.  Keep in mind, the normal disclaimer applies around the fact it isn’t officially supported and if you break something, you’re on your own, etc.

1. Download the latest version of the Mobile Report Publisher
2. Create your mobile report
image
3. Save it locally vs. publishing it the server.  It doesn’t matter if you use either Excel data or shared datasets from your server.

image

4.  Find the file location where you saved it locally.image

Now change the file extension from .rsmobile to .zip
image

5.  Double-click on the .zip file to view the contents
image

You’ll see two image files called thumbnail.png and thumbnail-phone.png that look like the following and were generated when I first created this report.  These are the files you’ll want to replace, and you can replace one or both of them.

image        thumbnail-phone

6. Now, pick new images to use.  They need to be named the same as the ones with the file, and need to be in the .png format.  Ideally, they’ll have the same dimensions as the default files, which are –

thumbnail.png file – 1150×555
thumbnail-phone.png file – 550×825

That isn’t a requirement for this to work, but it does mean your pictures might look a little distorted if they don’t match.

I chose one of my son’s favorite stuffed animal to use as the new thumbnail.png file.

portrait

Once I saved the file and renamed it, I simply dragged it into the still zipped folder and answered yes when prompted to overwrite the existing file.  You see it has replaced the existing file, and the file size has increased significantly.  Something else to be aware of if you do this for multiple files.

image

Now, I can rename the file extension back to .rsmobile and then upload the file to my Reporting Services server.
image

image

Once uploaded, it will automatically recognize it is a mobile report based on the file extension, and put it in the right category in the portal.

image

I’ll also now see the new thumbnail I added to the file in place of the one generated by the Mobile Report Publisher.image

Here’s how it looks in My Favorites
image

And when I click the report tile, the report still renders as I’d expect in the browser:
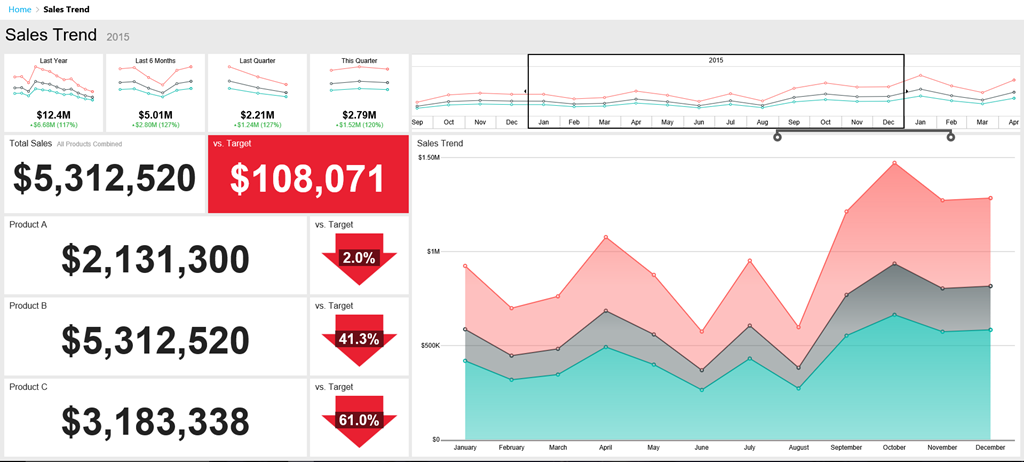
image

One thing to keep in mind – if I were to edit this report and re-publish or upload it, new thumbnails will get generated and overwrite the custom one(s) I added to the file.  So I’d have to do this each time I make changes to the report and re-save it.  That’s why this is a hack though, right?  🙂

Hopefully you enjoy this and have some fun playing around with this concept.  Have a great week!

What’s the deal with Excel and Power BI Desktop Files support in Reporting Services?

image

Hi all!

So one feature that was introduced in SQL Server 2016 RC1 for Reporting Services was the ability to store Power BI Desktop and Excel Workbooks files on the server.  This feature generated a lot of buzz on social media, with people looking to understand exactly what this means vis a vis the roadmap announced in October of last year.  With that in mind, I wanted to do a post that answered that question along with some others.  Let’s do that now using the tried and true fake interview format!

Wow, this is so cool.  I can now store Excel Workbooks and Power BI Desktop files in Reporting Services!

Yes you can!  Though to be fair, this feature has been around for quite some time.  We did add a few things, like calling these items out as separate report types, allowing you to add them as favorites and giving them a special icon.

That’s it?

Well, because they are resource files, you can could access them using the SOAP API.  That might be valuable for folks to take advantage of.

Is this the integration you announced at PASS last year?  Cause if this is all we’re getting, that’s pretty lame.

Nope, this is just a first step.  The team wanted to have something for folks when SQL Server 2016 launched, but it doesn’t change our plans at all for adding full support for Power BI desktop files in Reporting Services.

Great – when is that Power BI desktop support coming?  I want it yesterday!

We know, and we are as excited to bring that support to the product as you are to get your hands on it.  We’re heads down on SQL Server 2016 currently, and it’s top feature to get added post RTM.

So you’re not going to tell us a specific date?

I don’t have one to give.

Fine – can you at least tell us what features will it include?  Can I use custom visuals?  Will Q&A work?  Can I build dashboards like we can in the service?

Right now, the only thing we’re certain of is we’ll provide support to view and interact with the reports in a browser in Reporting Services.  We’re not in the business of providing the bare minimum, however.

That’s pretty rich coming from the team that didn’t do anything with the product since  –

Very funny.  Were there any other questions you had?

Wait a minute – you didn’t mention you’d be adding full support for Excel Workbooks in Reporting Services on your roadmap, but you added special support for those as well.  Does that mean – ?

Yes – well, probably.  There’s broad support to do that, and it’s a popular idea with our customers.  When those things are aligned, it usually means it will happen.

Great – when is it happening?

I dunno.

What??!  You just said –

I said probably – there’s still some stuff that needs to be finalized, and I certainly wouldn’t formally announce something like that on a personal blog post on April Fools Day.  If and when it’s official, you’ll be the first to know.

Are you saying this entire blog post is an April Fools Day gag?

No, absolutely not.

And there you have it.  Hopefully this gives you some additional context around the feature and what we’re up to as we prepare for the official launch of Reporting Services in 2016.  As always, have a great weekend!

Row level security options for Mobile Reports in SQL Server 2016

image

Welcome back!
With the latest release candidate of SQL Server 2016 now available for download, let’s take some time to review some options you have to implement row-level security for Mobile Reports.  These options can also be used for paginated reports in Reporting Services, so you don’t have to do the same work twice.

If you’re using SQL Server 2016 (or Azure SQL database) as your data source, you can take advantage of the new, built-in row-level security functionality.  My colleague, Patrick LeBlanc, does an excellent job walking you through how to get this setup in SQL Server 2016 in a blogpost here – http://patrickdleblanc.com/wordpress/?p=90, so I’m not going to redo all the steps he lays out nicely on his blog.  Since the old report manager has been replaced by the sleek new report portal in RC1, I’ve added a new screenshot below to replace the one Patrick included –

image

If you’re using a version of SQL Server prior to 2016 as your datasource, you can achieve something similar by creating a view that filters out records based on the user name accessing it.  Assuming I used the same dataset I used in the first example, my view would look like this –

SELECT        Student, SchoolRep, Class, Grade

FROM            dbo.Students

WHERE        (SchoolRep = CURRENT_USER)

I also have the option to use row-level security from an Analysis Services data source.  Here’s an example of how you could do this using a tabular AS model –

1. Setup the execution account in the Reporting Services Configuration Manager to run as an account of your choosing –
image

2. Grant this account admin permissions on your Analysis Services instance

image

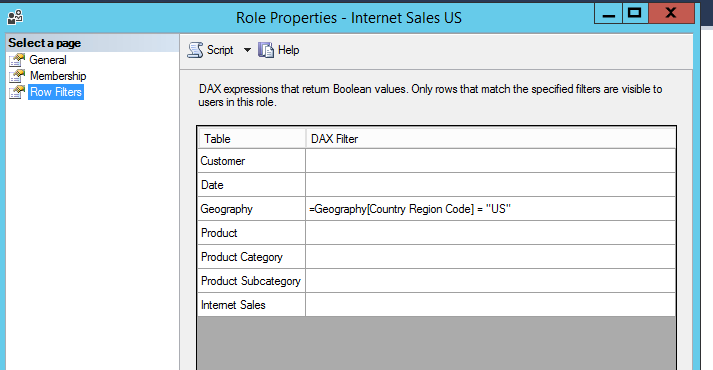
3. For the data source you’ll be using for your mobile report, setup roles for your users to be mapped to.

image

Add users or groups to these roles –

image

And setup the filters for the roles accordingly.  These are the records anyone assigned to that role will be limited to seeing.

image

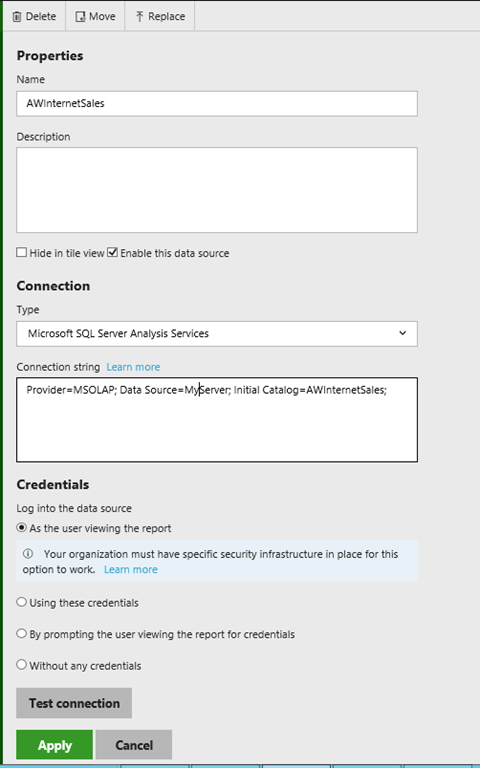
In Reporting Services, when you setup the shared data source for Analysis Services, it’d be setup like this –
image

Note –  Unless you have Kerberos setup in your organization, the Analysis Services and Reporting Services instance will need to be on the same server for this setup to work.

Regardless of which of these options I choose, I’ll always need to do the following steps to create and publish my mobile report –

1. Create my shared dataset in Report Builder or SQL Server Data Tools –

image

2. Save it to my RS server –

image

3. Create my mobile report using the SQL Server Mobile Report Publisher –
image

4. Hook up my shared dataset to the visual elements –
image

5. Preview It in the Publisher –

image

6. If everything looks good, I publish it to my server so people can view it –
image

And there you go!  This is one of a series of articles I’ll be doing both on my personal blog and the Reporting Services team blog over the next few weeks to show you how to get the most out of investment in Reporting Services in SQL Server 2016.

Thanks for reading!

So refreshing–How data refresh works with Mobile Reports and KPI’s in Reporting Services

image

With the release of SQL Server 2016 CTP 3.3 and the latest version of the Mobile Report Publisher Preview both now available, I thought it would be a good time to review how data updates work for Mobile Reports and KPI’s in Reporting Services.

As I reviewed in a previous post, you need to create a shared dataset to use in your mobile report or KPI that you save on the server.  This is similar to what you would do in Datazen, where you’d create a query against a data source on the server and then use it for either a dashboard or a KPI.  However, the way data is updated for KPI’s using a shared dataset works a little differently than it does with Mobile Reports.

Let’s review the Mobile Reports scenario first – In Reporting Services, by default, the shared dataset will always be up-to-date with the latest data.

image
They’re live!

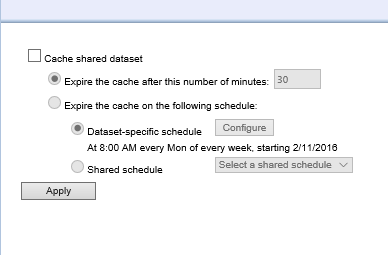
So if I create a query against a SQL Server table for my dataset, every time I run a mobile report, that query will execute and bring back the latest data.  This might not be ideal for performance reasons if hundreds/thousands of users are potentially using that report frequently.  So Reporting Services has an option to cache the dataset on a periodic basis – that way, the data is saved periodically on the Report Server and isn’t always going back against the live data source.

image
You need to setup caching in the old Report Manager in CTP 3.3

It’ll make sure everyone who runs the report is getting consistent results and response times are potentially faster.  If you do this for your mobile reports, you won’t see any updates to your data until the cache expires and the query then executes against the underlying dataset again.

With KPI’s, this doesn’t work the same way – for your KPI’s to be updated with the latest data from your shared dataset, you must have caching turned on AND also have a cache refresh schedule enabled to preload the cache with fresh data.

image

Why does it work differently than Mobile Reports?  Well, imagine if you have forty KPI’s on the home page of your portal.  When you first load the site, if it worked the way it did for mobile reports, it would execute at least forty queries all at once to load the data for each KPI.  And since you can setup multiple datasets for different elements of a KPI, you’d potentially be running over 100 separate queries just by going to the home page.  Multiply that by several users doing it at the same time, well, you get the idea.  So make sure you setup a cache refresh plan

Hopefully this helps you understand what your options are around refreshing your data for your mobile reports and KPI’s in SQL Server 2016.  Thanks for reading!

How to create surveys in OneDrive and view the results in Power BI

So, this blog post is the result of the pestering request of one Jen Underwood, who I mentioned this to previously as something I’d done for some internal work at Microsoft.  Apparently, a number of people aren’t aware there is an easy way to create surveys using OneDrive and Excel Online.  It’s a great way to quickly create an anonymous survey that you can share a public link to.  And because the results are immediately saved in an Excel document in OneDrive, you can use PowerBI to view those results as they come in!  Here’s how you do it –

1. Sign up for OneDrive (duh).

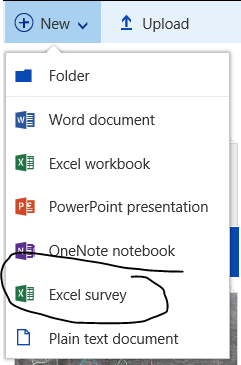
2. Once you’ve signed up/in, go to the new menu.  Here you’ll see the option to create a number of new documents, including an Excel survey.  Choose that.

image

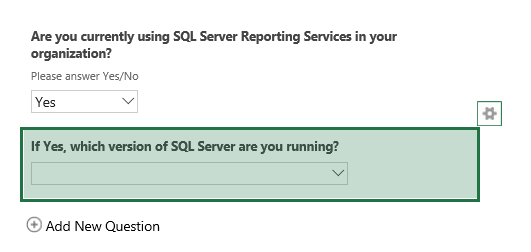
3. A new browser window will open and you can create your survey by giving it a title, description, and begin entering your questions by clicking on the little gear that appears as click in the area to enter.

image

4.  The questions can be multiple choice, true/false, text responses, etc.  You can also make them required or mark if they have a default answer.
image

Once you’ve finished, your question will appear in the list you’ve added to your survey in the order you create each one.

image

5. Continue adding questions until you are finished.  You can move the order they appear in around at any time by simply hovering over a question, clicking it, and then dragging it to the place you wish it listed.

image

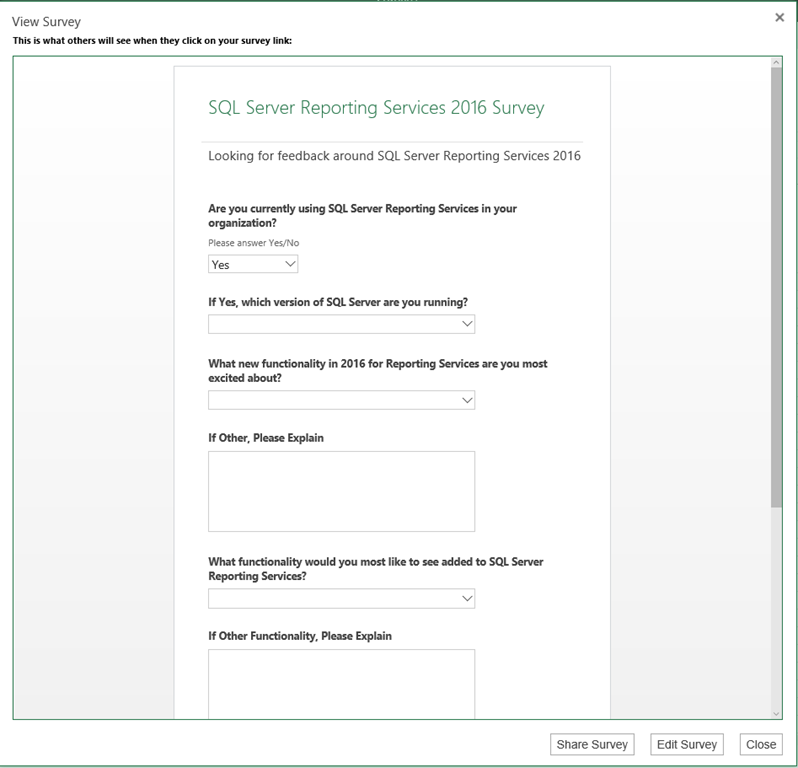
6. Once you’ve finished, if you hit “Save and View”, you can preview what your survey will look like for those using it.

image

If everything looks good, you can hit the “Share Survey” button, and a link will be generated that you can share so users can fill out the survey.
image
There, my survey is done.  I invite you to fill it out here – http://1drv.ms/1SXqFt5

Now that my survey is finished, I’ll want to report on the results using Power BI.  I can do that right from the Power BI site.

1. Go to PowerBI.com and login to your Power BI site (or sign up if you haven’t already).
image

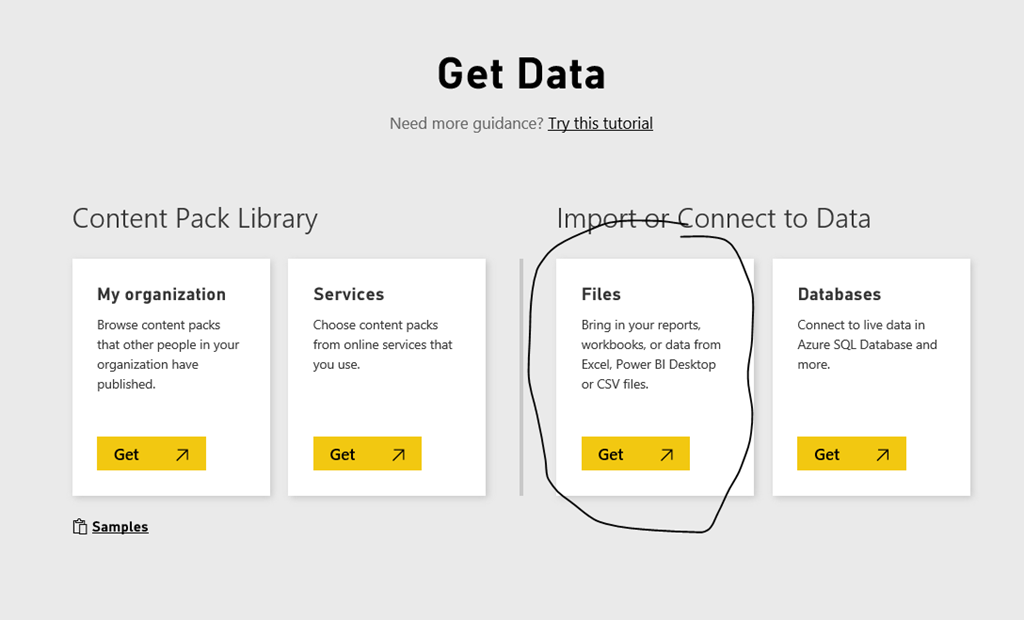
2. Once you’ve done that, go to Get Data, and then choose Files
image
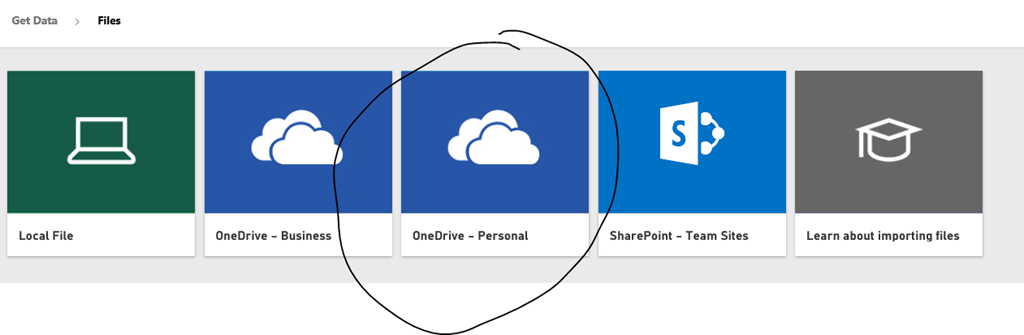
3. Choose OneDrive-Personal and select the survey you just created
image

And that’s it – you can now create your report to show the results as they come in from the survey.  Simply design it, name it and save it.

image

And now with the new Power BI public embedding, everyone can see the results that come into my report.  So fill out the survey here – http://1drv.ms/1SXqFt5

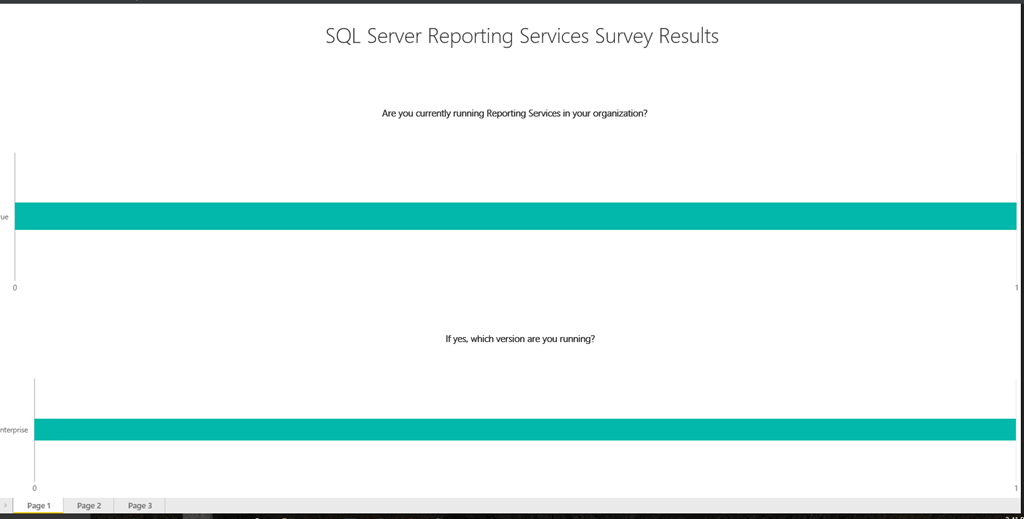
And view the results here – Survey Results

Thanks for reading, and I can finally tell Jen to quit bugging me to write this post.  Smile

Solved: (500) Internal Server Error in Mobile Report Publisher

image

This is a quick blog post for a Friday, but one that might help some of you who’ve run into this issue.

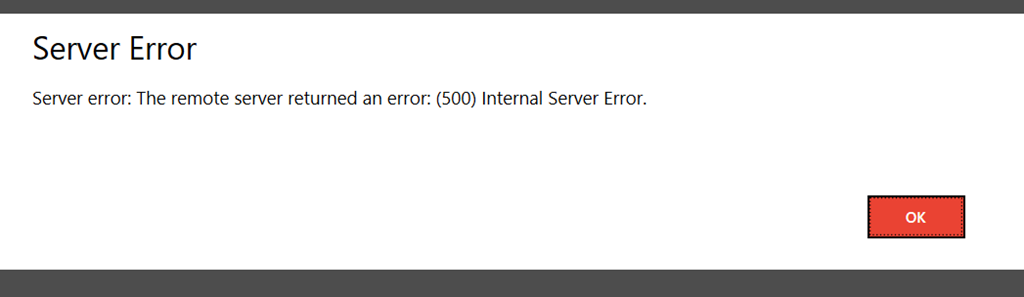
Certain users have reported getting an error when connecting from the new Mobile Reports Publisher from a shared dataset they published in Reporting Services. 

image

After doing some investigation, we were able to determine the issue comes up only when the data set had been published using SQL Server Data Tools.  The issue does NOT appear when you are using a shared dataset you created and published in Report Builder.  We’ve already fixed the issue for future releases, but for now, there are two ways to workaround this –

1. Use Report Builder to create the shared dataset vs. SSDT

2. Edit the shared dataset .rsd file using an XML/text editor.  For the entry for the dataset in the file, change it from this –

<DataSet Name=””>

To something that doesn’t leave it blank.  It could be this, for example –

<DataSet Name=”DataSet1″>

Then re-save the file to the server, and it will work without issue.  Entering a value there won’t affect anything else around the dataset, including the name you assigned it when you save it.  It just prevents the error from being thrown by the Mobile Reports Publisher around having a blank entry for the dataset name.

Hope this is helpful to anyone having this issue, and thanks for reading!