Using URL parameters with Mobile Reports in Reporting Services

image

One area I’ve found folks looking for additional information recently has been how to use URL parameters with Mobile Reports in SQL Server 2016 Reporting Services.  This was a fairly popular feature in Datazen, so naturally people want to use it in SQL Server 2016 as well.

Quick background for folks who don’t know what URL parameters are in the context of mobile reports.  You can create a mobile report with parameters in SSRS 2016 so you and your report readers can filter your reports.  This is helpful when you have a large dataset, for example, so not all the records are loaded at once (If you aren’t familiar with how to write a shared dataset query with parameters in Reporting Services, you can learn more about that at this link – https://msdn.microsoft.com/en-us/library/dd239345.aspx).  Sometimes, you’ll want to provide those parameters as part of the URL for the report.  This can be useful if the report is a drill-through target from another report you’re viewing, for example.

First off, there is support for this feature.  You can find documentation on MSDN for it here – https://msdn.microsoft.com/en-us/library/mt772301.aspx

The article, however, only covers the basic scenario around using a dataset parameter.  Dataset parameters are passed on to the shared dataset that they were specified for when you created the mobile report. The parameter name must be specified as:

<Dataset Name>.<Parameter Name>

Below is a sample URL for supplying a value for the @Reqtype parameter of for an ExecutionLogs dataset:

http://rsserver/Reports/mobilereport/ExecutionLogs%20with%20Filter?ExecutionLogs.@Reqtype=Subscription

There are also parameters that are tied to the selection state of the control in the mobile report it was specified for.  These can be thought of as selection control parameters.  An easy way to find the name of the selection control to use in your URL is on the “Set drillthrough URL” screen in Mobile Report Publisher.

image

Like dataset parameters, the parameter name must specified in the following manner:

<Control Name>.SelectedItem
<Control Name>.SelectedItems

Below are sample URLs for specifying these:

http://rserver/Reports/mobilereport/ExecutionLogs%20with%20Filter?SelectionList.SelectedItem=Subscription

http://rsserver/Reports/mobilereport/ExecutionLogs%20Multi?SelectionList.SelectedItems=Subscription,Interactive

A special type of selection control in Mobile Reports is the Time Navigator control.  The time navigator control supports the following properties you can set in your URL –

– SelectedStartTime
– SelectedEndTime
– ViewportStartTime
– ViewportEndTime

The values for these properties are date time values formatted like this – “2017-02-15T00:00:00”.

Please Note: the “:” character needs to be URL encoded as “%3A” (browsers will usually do this automatically for you).

Now please read carefully the following item, because here’s where folks often run into trouble – if a user specifies a dataset parameter value via the URL and there is also a selection control wired up to supply values for the very same dataset parameter, a conflict occurs. The mobile report resolves this conflict by applying the dataset parameter value supplied via the URL (and discarding the initial selection control value). Note that this is true even as the user starts interacting with the report and chooses other selection values!

You can easily avoid this by supplying a selection control parameter via the URL instead of a dataset parameter.  The MSDN article is being updated to reflect this information as well, but keep this in mind when you are designing your mobile reports.

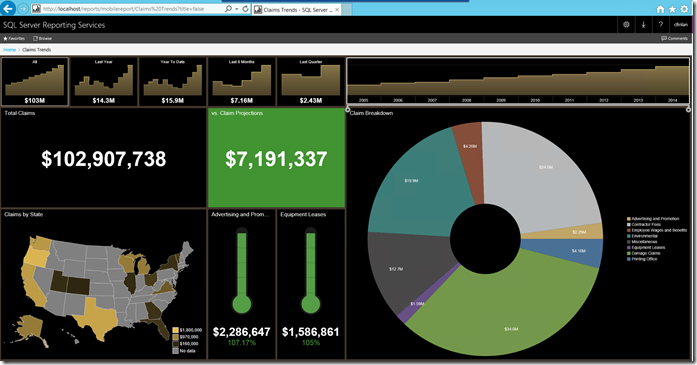
Finally, there is an item you can apply to your entire report via URL, and that’s to enable/disable showing the report title.

To disable the title, simply add “?title=false” to your URL, so it looks like the following –

http://rserver/reports/mobilereport/Claims%20Trends?title=false

If you want to show the title, just don’t add this to your URL.  Simple enough, right?

Hope this has been helpful for you and helped clear up a few things on this topic.  I want to give a special thanks to Andre M. from the engineering team for helping me with this blogpost.
Why Mobile Reports and Power BI Reports aren’t a zero sum decision in SQL Server Reporting Services

There are two questions I’ve gotten for months.  And with the first public preview of Power BI reports in SQL Server Reporting Services, they’ve grown louder in the past week or so.

“Will we be able to view Power BI reports hosted in SSRS in the Power BI mobile app?” (Yes, we’re planning to support that scenario)

“If so, why should I still use mobile reports?” (Sigh)

I’ll admit, I understand one of the biggest driving factors around this question is not wanting to “bet on the wrong horse”.  And yes, a major reason people are concerned about doing that is because of, well, Microsoft and some decisions made at various points in the company’s history around certain products.  But I can only offer my opinion on this particular question and what I’d tell a customer if they asked me question two today.

Recently, Power BI added the ability to create mobile optimized layouts for reports.  But no one has been asking if they should still create mobile optimized dashboards now that they have this new functionality.  Why not?  Because they aren’t really an either/or proposition.  You have a dashboard to give you an overview of your business metrics, and then can dig into more detail by clicking a tile and jumping into a report.  In the context of SQL Server Reporting Services, it’s probably better to compare the mobile report use case to Power BI dashboards rather than Power BI Reports.

By doing so, it helps customers avoid the single biggest issue people run into today with mobile reports (and previously Datazen).  What’s the issue exactly?  Well, they’re trying to use it to build reports the same way they do with Power BI Desktop.  They want interactive reports that allow drag and drop, ad-hoc analysis and can handle hundreds of thousands of records in a data model they build on the fly.  They did this previously because they didn’t have an option to run Power BI reports on-prem.  Now that they will, that shouldn’t be an issue any longer and they can use the best tool for that purpose, which is Power BI Desktop.

Similarly, there are certain use cases today where it may be advantageous to build a mobile report as my “dashboard”, instead of just building it in Power BI Desktop directly.  Today, a few of these include –

– I need my mobile report to be available for my users offline and still be fully interactive.  Power BI reports are viewable offline, but have certain limitations.

– I like having the thumbnail view of my mobile reports on devices for my users to see a quick preview of what the report looks like, especially in combination with KPI’s I’ve created.

– I can add URL’s that link to other content from items on my mobile report, or add url parameters to pass with that as well.

– Some users have specifically told me they like the fact they can add content from different data sources to a mobile report without building another data model.  Why?  They can then filter across all of those data sources in a mobile report, which I know some folks have wanted to see in the dashboards in Power BI.

– I need to view the reports in a mobile phone browser vs. the app.  For on-prem customers, there are often additional challenges having users leverage native apps to view the content vs. a web browser on the device.  The Mobile Reports will look the same in a phone browser as they will in the mobile app, and for some customers, that’s pretty important.

Sure, there are other benefits I get from mobile reports as well, including the whole “design first” option.  But doing a “feature shootout” as of today misses the point – I see mobile reports as a complimentary item to Power BI Reports, just as they are a complimentary item to paginated reports.  They give users an additional way to meet their customer’s needs, and could play a huge part in a customer’s solution, or no role at all.  And since we’ve already stated that adding Power BI dashboards is not on the short term roadmap, I feel very comfortable telling users there is a lot of business value you can derive out of using both options with SQL Server Reporting Services for the foreseeable future.

Now, could that change down the road?  Could Power BI Desktop becomes the single tool used to create mobile and paginated reports in addition to what it does today?  After all, we stated in our blogpost last year that “We intend to standardize reporting content types across Microsoft on-premises, cloud and hybrid systems.”  Does that mean we could consolidate everything into one tool as well?  I guess, but there’s a pretty healthy debate you can have on whether its better to have one tool to do everything, or specialized tools for each report type.  Trust me, I’ve been in this debate many times already.  And it’ll really depend on what it always does – what do our customers think is the best option moving forward?

There you have it – one man’s opinion on the subject.  And I’m sure there are people who will read this and disagree completely.  Great – I wouldn’t have it any other way.  🙂

Feel free to let me know what you think in the blog comments, and have a great week!

SQL Server Reporting Services Grab Bag, Part 2 – Mobile Reports URL Parameters, Web Application Proxy, User-based parameters, Farewell, LightSwitch and PASS

image

Welcome back for part two of my “grab bag” series, where I attempt to cover multiple topics around SQL Server Reporting Services without boring you to tears.  Let’s dive right in, shall we?

1. A topic that often comes up is “Can I pass parameters via URL to my mobile reports?”  This answer is yes, however, there is something I wanted folks to be aware of when they use this functionality.

The linked article I referenced covers how you can do this with a dataset based on a SQL Server Analysis Services MDX query, but it doesn’t currently say that it only covers that scenario right now.  We’re updating the article to show the difference for how the URL needs to be formatted for SSAS and SQL based data sources, which I’ll also cover here.  In the following screenshot from that article, you’ll see the parameter we want to pass is for the Category column in the TimeChartLoD dataset.  So depending on what the data source is, for step 4 I’d need to format it two different ways –

mobile-report-publisher-parameter-data-view

If it’s based on SQL Server, then it requires the @ sign before the column name, and would look like this.

http://sampleserver/reports/adventureworks-reports/adventureworks-load-on-demand?TimeChartLoD.@category=Clothing

If it’s based on Analysis Services, then no @ sign is required, and would look like this.

http://sampleserver/reports/adventureworks-reports/adventureworks-load-on-demand?TimeChartLoD.category=Clothing

That (hopefully) clears up the confusion on that point, and again, you’ll see that article updated with this additional detail in the next few days.

2.  While we’re on the topic of parameters, one item that tends to trip folks up is around using user-based parameters to enforce row-level security.  This usually happens because unlike other parameters for mobile reports, you don’t need to use a dropdown list in your mobile report to pass this parameter, nor does it need to be called out in a URL.  I covered how this works in a blogpost earlier this year that may help with your questions on that.

3. Another question I get quite a bit is around how to setup an SSRS server to allow users access to their reports when they aren’t on the corporate network.  There are some blog posts out there that touch on this topic, including one done by Jaime Tarquino (who happens to sit right next to me in the office) that covers using Azure Active Directory Application Proxy to access your mobile reports and KPI’s with the native mobile apps.

Another option you should be aware of is using the Web Application Proxy for Windows Server (both 2012 and 2016) for this purpose.  This enables “reverse proxy functionality for web applications inside your corporate network to allow users on any device to access your web applications from outside the corporate network.”  I can confirm that this does work for SQL Server Reporting Services scenarios currently that require “browser only” access.  While this isn’t currently supported by the native mobile apps (because you need to authenticate using ADFS), I think it’s fair to say it’s something we’re actively looking at supporting as well.

Image result for visual studio lightswitch

4. I wanted to take a moment to call out the recent blog post by the Visual Studio LightSwitch team where they announce that LightSwitch will no longer be in future releases of Visual Studio.  For those of you following this blog, you know I loved that product and used it extensively in my day to day work before coming to Microsoft.  I am genuinely sad to see it go, especially since it was responsible for me even being hired by Microsoft in the first place (that story is an entire blogpost of its own).  That being said, I have complete confidence in the team working on PowerApps to create a worthy (and superior) successor to LightSwitch.  In fact, I’d argue it will offer a far better option for many users who were interested in in tools like LightSwitch but were intimidated by the idea of using Visual Studio to build LOB applications (I saw this firsthand quite a bit).

5. Finally, I’ll be co-presenting at SQL PASS this week along with Riccardo Muti around what’s new and what’s coming in Reporting Services.  In fact, I might even be demoing some functionality I know many of you are quite interested in.  I highly recommend attending this session if you’re a fan of SQL Server Reporting Services and want to hear (and see) more about what’s coming next.

See you at PASS and have a great weekend!

Free custom map shapes for SQL Server Mobile Reports and Grab Bag Part 1

image

Happy Saturday to all!

As you may have noticed, I haven’t posted on my personal blog in some time (although I have been posting over at the SQL Server Reporting Services team blog fairly regularly).  If you’re wondering why, just watch the presentation Riccardo Muti gave at Ignite this past week, where he showed an early preview of publishing Power BI Desktop reports to SQL Server Reporting Services.  We’ve all been extremely hard at work on that, but with the (undefeated) Philadelphia Eagles off this weekend, I wanted to take some time to do a “catch-up” post where I touch on a number of topics.

1. There is a new version of the SQL Server Mobile Report Publisher now available for download.  I am planning on doing a post on the official team blog about this (and yes, it will list all of the changes that were included in the release), but I wanted to bring one item to your attention that was addressed in this release since this was something multiple customers asked us to address –

Dataset column names should be made more presentable before displayed in mobile report

Previously, if you had column names with underscores in your dataset, there was no way to remove those underscores or show a user friendly name for your report.

image

Now, when you create a mobile report, you’ll see that we now hide the underscores when presenting the column name in the report.

image

You’ll also need to install the latest cumulative update for SQL Server 2016 to make sure mobile reports you create and view on the server reflect this change as well.

2. A number of people had been looking for ways to more easily build custom brand packages for SQL Server 2016 Reporting Services.  A new third party tool is now available on CodePlex called the SSRS Branding File Editor that lets you use an Excel template to do everything around that process.  Folks who’ve tried it have let me know they’ve found it quite useful, so I’d encourage you to take a look.

3. We recently released an update for Report Builder (that I wrote the blogpost on) where we alluded to some improvements that were related to shared datasets.  These should help significantly with shared datasets built against SQL Server Analysis Services data sources for your Mobile Reports, especially if your datasets have parameters in the query.  However, because a few of these fixes also required some updates on the server, you won’t be able to take advantage of all of them until we have our next server update sometime later this year.

4. I pulled together some of the custom map shape files previously found on the sample Datazen dashboards, including the jumbo jet and stadium map files.  You can download these for use in your mobile report projects if you’re interested.  As usual, these maps aren’t officially supported by Microsoft in any way.

5. One of the pieces of feedback we’ve gotten recently is folks asking about the documentation for Mobile Reports and KPI’s in SQL Server 2016.  While the best place to get started for this is the MSDN documentation, it sounded like folks were looking for more advanced topics as well.  Feel free to leave me a comment if there is a specific topic or walkthrough you’d be interested in seeing a post on, or even having it added to the MSDN documentation.  I can’t promise I’ll be able to tackle every topic right away, but I’d definitely would like to.

Hmm – I wasn’t planning on focusing just on mobile reports this post, but that’s how it turned out.  I guess that means I’ll just need to do a part 2 of this post as well.  Until then, enjoy the rest of your weekend!

SQL Server 2016 Mobile Reports – Free Maps of the Week, Final Edition!

image

Here it is – the final post in the free maps of the week series.  Use the links below to download the zipped map files.  You’ll need to unzip them and follow the directions here to use them in your mobile reports.

Hungary – Download
Iceland – Download
United Arab Emirates – Download
Sweden – Download
Singapore – Download
Serbia – Download
Panama – Download
Indonesia – Download
Israel – Download
Lichtenstein – Download
Kuwait – Download
Lithuania – Download
Luxembourg – Download
Macedonia – Download

Remember, these maps aren’t officially supported by Microsoft in any way.  It’s been fun doing these, and thanks to everyone who’s stopped by and grabbed some.  Enjoy!

SQL Server 2016 Mobile Reports – Free Maps of the Week, Part 5

20160627_201100808_iOS

Hi all!

Sorry for the delay, but I’ve been on vacation with my family and haven’t had time to post any new maps until tonight.  Because of that, I’ve got an extra long list of free maps for you this week.  Use the links below to download the zipped map files.  You’ll need to unzip them and follow the directions here to use them in your mobile reports.

Cuba – Download
Cyprus – Download
Czech Republic – Download
Egypt – Download
Turkey – Download
Thailand – Download
South Korea – Download
Slovenia – Download
Slovakia – Download
Saudi Arabia – Download
Romania – Download
Macau – Download
Monaco – Download
Montenegro –Download

Remember, these maps aren’t officially supported by Microsoft in any way.  I’ll be back with more free maps after the long holiday weekend here in the States.  Thanks!

SQL Server 2016 Mobile Reports – Free Maps of the Week, Part 4

image

Hi all!

Another week, another set of free maps for SQL Server 2016 Reporting Services Mobile Reports.  Use the links below to download the zipped map files.  You’ll need to unzip them and follow the directions here to use them in your mobile reports.

Russia – Download
Croatia – Download
Finland – Download
Japan – Download
New Zealand – Download
Norway – Download
Pakistan – Download
India – Download

Remember, these maps aren’t officially supported by Microsoft in any way.  I’m working my way through even more, so look for an even larger list of maps being made available next week.  Thanks!

SQL Server 2016 Mobile Reports – Free Maps of the Week, Part 3

image

Hi everyone – once again, I have a new set of free maps I’ve pulled together to share with all of you as we celebrate the official release of SQL Server 2016.

Use the links below to download the zipped map files.  You’ll need to unzip them and follow the directions here to use them in your mobile reports.

Cayman Islands – Download
South America – Download
Ukraine – Download
Micronesia – Download
Jamaica – Download
Hong Kong – Download

Remember, these maps aren’t officially supported by Microsoft in any way.  This blog series seems to be fairly popular regardless, so look for even more next week.  Thanks!

Free Sample Mobile Reports for SQL Server 2016 Reporting Services

image

Hi all – I was hoping to get to this over the weekend, since I know a number of folks were looking for some sample mobile report files they could use as a starting point for building new reports in SQL Server 2016 Reporting Services.  While we weren’t able to include any sample files as part of the Mobile Report Publisher install, I do have some sample files I use that I’m happy to share with you to use as you’d like.  Just download the zip file, open one of them in Mobile Report Publisher and you have a great starting point for your own mobile report(s).

The usual disclaimer applies that these samples aren’t officially supported by Microsoft in any way.

Sample Mobile Reports – Download

Enjoy, and I’ll have more sample map files available for you later this week.

SQL Server Mobile Reports – Free Maps of the Week, Part 2

image

Hi everyone – as promised last week, I have a new set of free maps I’ve pulled together to share with all of you as we get even closer to the GA of SQL Server 2016.

Use the links below to download the zipped map files.  You’ll need to unzip them and follow the directions here to use them in your mobile reports.

World Countries – Download
Europe – Download
Bosnia-Herzegovina – Download
Bulgaria – Download
Spain – Download

Remember, these maps aren’t officially supported by Microsoft in any way.  But if you find these helpful, be sure to check back next week for even more free maps.  Have a great rest of your holiday weekend (well, if you’re in the US, anyways)!