Ten things you might have missed in the Technical Preview of Power BI Reports in SQL Server Reporting Services

image

Whew – this is my fourth (and final!) blogpost in four days around the Technical Preview for SQL Server Reporting Services.  It’s been a lot of work, but also a lot of fun putting these together.  For my final post, I wanted to touch on ten items you’ll see (and can try) in the preview to ensure you don’t miss them.

Before I do that, however, I wanted to take a moment to say “Thank you”.  This past week at PASS Summit 2016, and the reaction from the community to this entire preview, has been one of the highlights of my entire career.  I got to meet several of you for the first time at PASS, and as you learned very quickly, I’m not someone to sugarcoat things.  You all embraced this very unique preview and made the engineers who were on-site at PASS from the Reporting Services team feel like the rock stars they are.  That type of passion and energy is so infectious, again, I can’t thank you enough for letting the team know how excited you were with what we’ve delivered to date.  Our customers are the reason we fought so hard to bring this to you, and I promise, this is the just the first step.  We’re already back at it, working hard to bring you the first installable preview of this functionality as quickly as possible.

1. You can access your VM in Azure through a web browser

If you’d like other users to view and interact with the technical preview without remoting into the VM.  This is helpful if you’d like to show it to additional people in your organization, give users read-only access, etc.  Keep in mind, you’ll still need to do all creating/editing of Power BI Desktop reports on the VM directly using Remote Desktop.

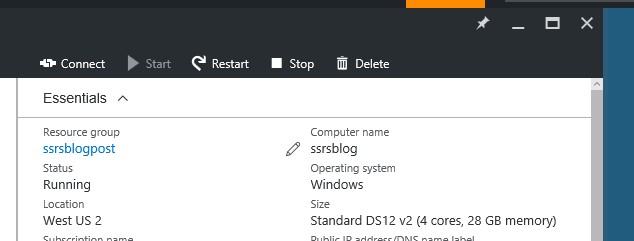
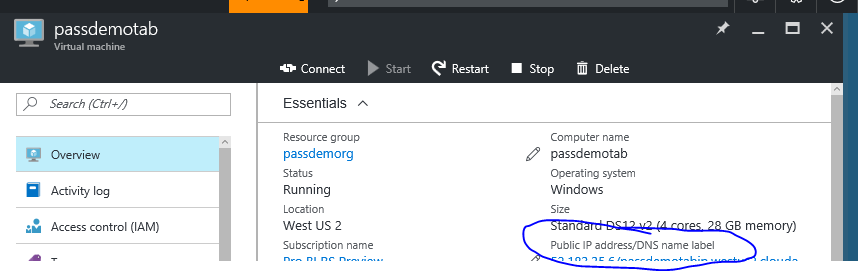
To try this out, find the public IP address of the VM in Azure listed in the essentials section
image

Open a web browser on your local machine and type in the address/reports in the following format – http://8.8.8.8/reports (enabling https for the VM is something that is a little tricky to do, so I’ll have to decide whether that’s worth doing a future post around or not).  Enter your username and password for the VM, and you’ll be granted access to the report portal.
image

2. You can use embed the Power BI Reports just like mobile and paginated reports.

If you’d like to see your Power BI Report in an iFrame, you can add ?rs:Embed=true at the end of the report url.  For example, here is the embed url for the Sample Sales Report when connected directly to the VM via remote desktop – http://localhost/reports/powerbi/Sample%20Sales%20Report?rs:embed=true

image

3.  Mobile Reports and Power BI Reports both are available in the execution logs.

This is a common request for those folks interested in seeing when people ran certain reports and how often they did so.  If you go into the ReportServer database catalog via SQL Server Management Studio and run a query using the ExecutionLog3 SQL view, you’ll see log entries for both of these report types now show up –

image

4.  Direct url navigation is now available for KPI’s.

image

Users have so liked the new reporting services interface, they’d asked for an easy way to link to other content directly from the portal homepage so everyone can use the new portal as a starting point in their organization.  With this in mind, we added an additional option to KPI’s called “Direct Navigation”.  This allows you add a custom url as related content, just like you can in the portal currently, and simply bypass the current KPI pop-up action you get when you click on the KPI and go directly to the linked content.

For any KPI’s that you use this feature with, you’ll a little “link” in the upper right-hand corner of it so you can tell that it is enabled.  This will give the ability to create “dummy” KPI’s that you use just to link to outside content.

image

5.  You can turn report comments off for certain users by creating a custom role in SQL Server Management Studio and assigning it to them for folders/reports.

image

One piece of customer feedback we got when considering the comment feature was the need to give report owners the ability to restrict certain users from adding or viewing comments.  To accomplish that, we added new tasks for comments in Reporting Services that are assigned to security roles.  Security Roles in Reporting Services are managed through SQL Server Management Studio.  You can create a new role without these permissions and assign them to users accordingly by following the steps in this article.  (We’d recommend you hold off on changing the security roles for the Power BI reports in the Technical Preview, since we’re aware of an issue that was reported on another blog.)

6. You can favorite Power BI Reports just like any other report type

image

7. You can install another instance of Analysis Services on the same machine to have both Multidimensional and Tabular running simultaneously.

image

During setup, you get the option to run the VM with either Tabular or Multidimensional mode already running (along with demo Power BI content tailored for it).  However, if you really want to have both modes available on your machine, the developer edition installation files used for both the database engine and Analysis Services are located here on the VM – C:\SQLServer_13.0_Full

Simply add a new stand-alone instance of Analysis Services on the same machine and you’ll have both options available to build reports against.

8. You now have the option for a “List” view of your items in the portal

image

Simply toggle the layout option in the View menu in the portal to switch view types.

9.  A new, expanded context menu is available when you click the ‘…’ option for that item.

image

You’ll hear much more about items 8&9 in a future blog post on the Reporting Services team blog.

10. The Technical Preview VM will expire in six months.

Also note, the expiration date is six months from the date it was first made available in the portal.  Just be aware of this, and keep in mind you’ll probably want to migrate any content you put on there prior to this date.

And we’re done – finally, I can take a few hours to relax and watch the big Eagles/Cowboys game this evening.  I’m in such a good mood, I might not even care if the Eagles lose to Dallas.

Yeah, no, I’ll care – Go Birds!

Embed from Getty Images

How to run the Technical Preview of Power BI Reports in SQL Server Reporting Services on-prem using Hyper-V

hypervfinished

What a week!  With the announcement and release this week of the Technical Preview of SQL Server Reporting Services in Microsoft Azure, it’s been a whirlwind of activity and excitement.  And while people have generally been excited to go ahead and spin it up in Azure, there are still some folks who’d like to try out the preview on their local PC using Hyper-V.  Here’s how you can do just that.  I’ll also point out one big “gotcha” that I ran into doing it this way –

1.  Go through all the initial steps outlined in this blog post to get the machine up and running in your Microsoft Azure account.

2.  In Azure, find the Virtual Machine you just created and stop it by clicking the stop button.

stopvm

3.  Now, navigate to the resource group you created that contains the virtual machine.  You’ll see it setup several items, including two storage accounts.  Select the storage account that has “vhd” in the lengthy name, as this is where the virtual hard drives are stored.

image

4.  As you click into the storage account details, you’ll see two disk drives – one is labelled “dataDisk.vhd”, and the other is labelled “osdiskforwindowssimple.vhd”.  “osdiskforwindowssimple.vhd” is the one you need to download.

vhdinfo

5.  You now have a couple options – you can simply click the download button that appears when you select the vhd, or you can use a separate program that may help accelerate the download process (remember, the file is quite large).  These (free!) options include –

– Microsoft Azure Storage Explorer
– Azure Explorer from RedGate
– AzCopy (advanced users only)

No matter which way you download it, the file will take awhile depending on your internet connection since it is 127 GB.  You might consider letting it run overnight like I did.

6.  Once your download is finished, you’ll need to setup a new virtual machine in Hyper-V to mount the virtual hard drive on.  This also means you need to have Hyper-V turned on in Windows.  With Windows 10, just follow the instructions in this walkthrough to do so.  If you have Windows 7, you can follow these instructions instead.

7.  Launch Hyper-V Manager on your PC to get started.  Select New Virtual Machine

newvirtualmachine

I’d recommend you name this new machine the same name you gave it in Azure, just for consistencies sake.  It isn’t required, but you might find it less confusing.  Hit Next

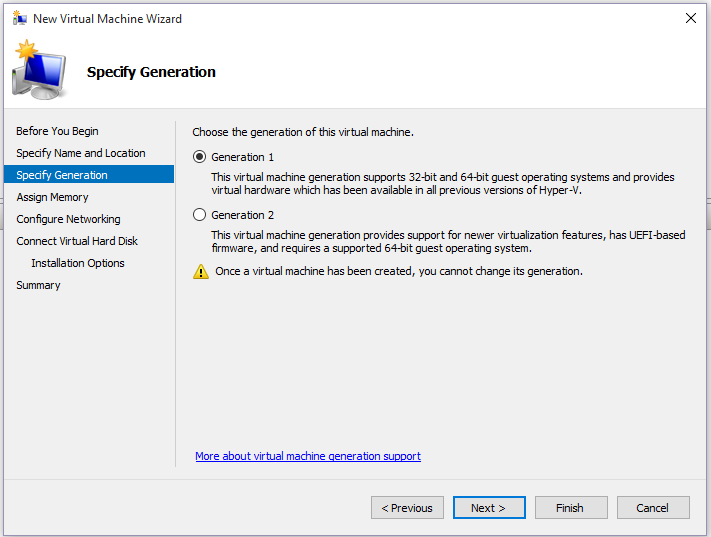
Choose “Generation 1” for this virtual machine.  Hit Next
image

You need to assign the amount of memory you’d like to make available to this virtual machine.  I’d strongly recommend assigning a minimum of 4 GB of memory to the virtual machine (remember, the machine we recommend in Azure has 28GB of memory), and really 8 GB (or more) is preferred.

image

For the purposes of this blog post, I am not going to assign a virtual network option for the machine.  This means I can’t access the internet from the VM (so Bing Maps won’t work if I choose a map visual), but I’m doing that to show you that yes, it can run entirely on-premises with no cloud dependencies.

image

Finally, I’ll select the virtual hard disk I downloaded from Azure to attach to the machine.

image

I’ll hit finish, and my new VM will show up in my list of virtual machines in Hyper-V manager.

image

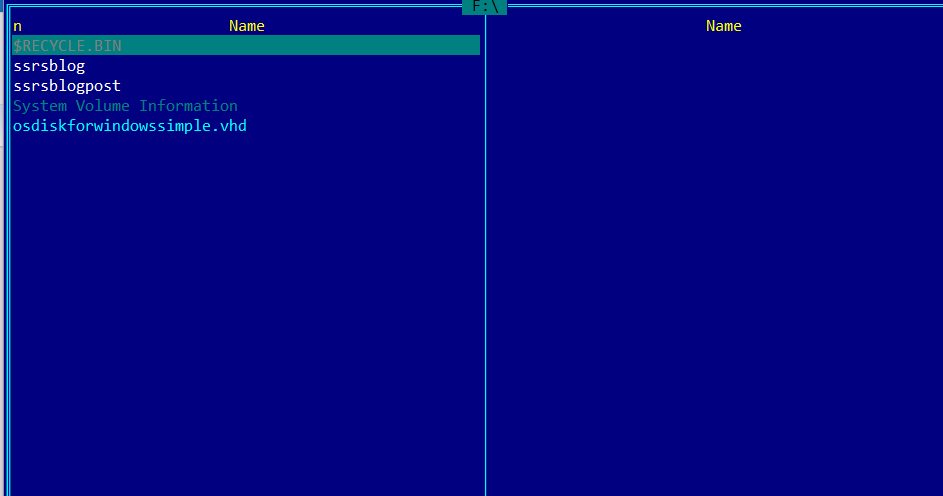
8.  Here’s where the big “gotcha” is/was – if you right-click on the VM and hit “Start”, it will attempt to start and then fail with an error message saying “The Version Does Not Support This Version of the File Format” or something to that effect.  The issue is related to the fact we didn’t dismount the hard drive from the Azure VM (which I didn’t want to do, because I wanted to spin it back up again in the future in Azure).  To workaround this, you need to have Windows unmark the .vhd as a sparse file.  There are several ways you could accomplish this, but the easiest I found was with a program called Far Manager, which is free to download and use.

Once you’ve installed it, open the program and click on the “n” in the upper left-hand corner (don’t be scared of the GUI, it’s easy, trust me).

image

A window will pop-up showing all of your local hard drives – browse to the drive you vhd is on.

image

Select the vhd from the file list and hit ctrl-A.  A new menu will pop-up and you’ll see a box marked “Sparse”.  Uncheck that box and the click { Set }

image

It’ll take awhile to finish doing that (10-15 minutes in my case), but once it’s done, go ahead and try starting your virtual machine again.  You won’t get that nasty error any longer.

9.  It’ll take a few minutes to boot up and finish prepping.  When it’s finished, you can login with the administrator username and password you used when first creating the VM.  You’ll now be using Power BI Reports in Reporting Services entirely on-prem.

image

I’ll be back tomorrow with some tips and tricks you might not be aware to help you get the most out of this technical preview.  Until then, have a great Saturday!

What’s the deal with Excel and Power BI Desktop Files support in Reporting Services?

image

Hi all!

So one feature that was introduced in SQL Server 2016 RC1 for Reporting Services was the ability to store Power BI Desktop and Excel Workbooks files on the server.  This feature generated a lot of buzz on social media, with people looking to understand exactly what this means vis a vis the roadmap announced in October of last year.  With that in mind, I wanted to do a post that answered that question along with some others.  Let’s do that now using the tried and true fake interview format!

Wow, this is so cool.  I can now store Excel Workbooks and Power BI Desktop files in Reporting Services!

Yes you can!  Though to be fair, this feature has been around for quite some time.  We did add a few things, like calling these items out as separate report types, allowing you to add them as favorites and giving them a special icon.

That’s it?

Well, because they are resource files, you can could access them using the SOAP API.  That might be valuable for folks to take advantage of.

Is this the integration you announced at PASS last year?  Cause if this is all we’re getting, that’s pretty lame.

Nope, this is just a first step.  The team wanted to have something for folks when SQL Server 2016 launched, but it doesn’t change our plans at all for adding full support for Power BI desktop files in Reporting Services.

Great – when is that Power BI desktop support coming?  I want it yesterday!

We know, and we are as excited to bring that support to the product as you are to get your hands on it.  We’re heads down on SQL Server 2016 currently, and it’s top feature to get added post RTM.

So you’re not going to tell us a specific date?

I don’t have one to give.

Fine – can you at least tell us what features will it include?  Can I use custom visuals?  Will Q&A work?  Can I build dashboards like we can in the service?

Right now, the only thing we’re certain of is we’ll provide support to view and interact with the reports in a browser in Reporting Services.  We’re not in the business of providing the bare minimum, however.

That’s pretty rich coming from the team that didn’t do anything with the product since  –

Very funny.  Were there any other questions you had?

Wait a minute – you didn’t mention you’d be adding full support for Excel Workbooks in Reporting Services on your roadmap, but you added special support for those as well.  Does that mean – ?

Yes – well, probably.  There’s broad support to do that, and it’s a popular idea with our customers.  When those things are aligned, it usually means it will happen.

Great – when is it happening?

I dunno.

What??!  You just said –

I said probably – there’s still some stuff that needs to be finalized, and I certainly wouldn’t formally announce something like that on a personal blog post on April Fools Day.  If and when it’s official, you’ll be the first to know.

Are you saying this entire blog post is an April Fools Day gag?

No, absolutely not.

And there you have it.  Hopefully this gives you some additional context around the feature and what we’re up to as we prepare for the official launch of Reporting Services in 2016.  As always, have a great weekend!

How to create surveys in OneDrive and view the results in Power BI

So, this blog post is the result of the pestering request of one Jen Underwood, who I mentioned this to previously as something I’d done for some internal work at Microsoft.  Apparently, a number of people aren’t aware there is an easy way to create surveys using OneDrive and Excel Online.  It’s a great way to quickly create an anonymous survey that you can share a public link to.  And because the results are immediately saved in an Excel document in OneDrive, you can use PowerBI to view those results as they come in!  Here’s how you do it –

1. Sign up for OneDrive (duh).

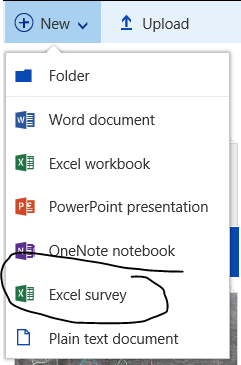
2. Once you’ve signed up/in, go to the new menu.  Here you’ll see the option to create a number of new documents, including an Excel survey.  Choose that.

image

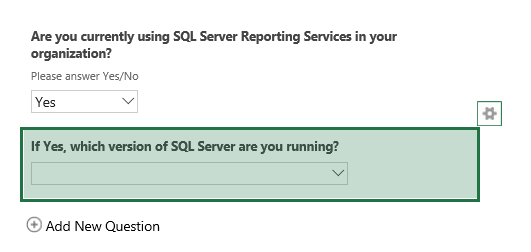
3. A new browser window will open and you can create your survey by giving it a title, description, and begin entering your questions by clicking on the little gear that appears as click in the area to enter.

image

4.  The questions can be multiple choice, true/false, text responses, etc.  You can also make them required or mark if they have a default answer.
image

Once you’ve finished, your question will appear in the list you’ve added to your survey in the order you create each one.

image

5. Continue adding questions until you are finished.  You can move the order they appear in around at any time by simply hovering over a question, clicking it, and then dragging it to the place you wish it listed.

image

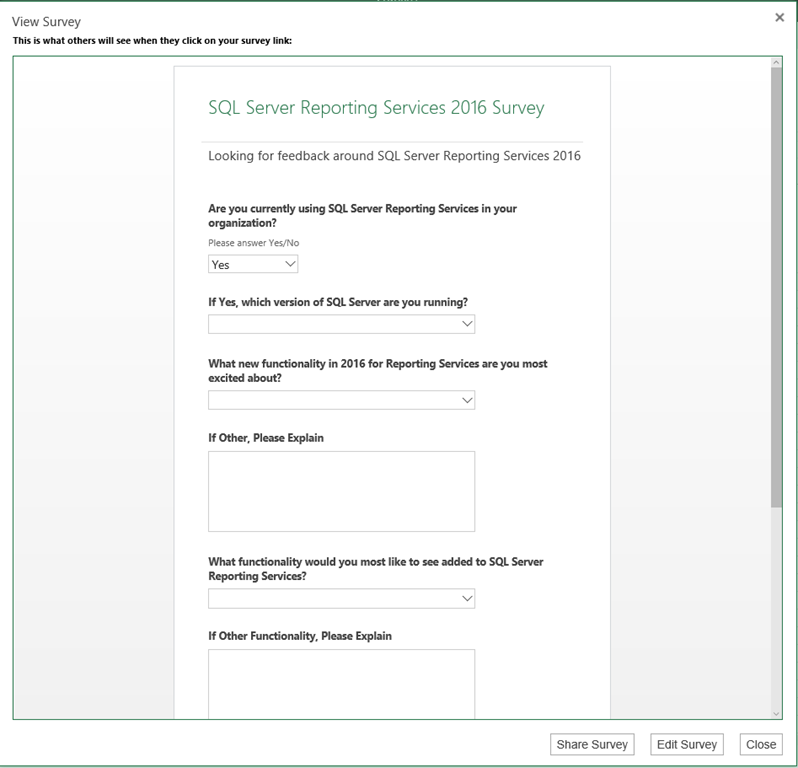
6. Once you’ve finished, if you hit “Save and View”, you can preview what your survey will look like for those using it.

image

If everything looks good, you can hit the “Share Survey” button, and a link will be generated that you can share so users can fill out the survey.
image
There, my survey is done.  I invite you to fill it out here – http://1drv.ms/1SXqFt5

Now that my survey is finished, I’ll want to report on the results using Power BI.  I can do that right from the Power BI site.

1. Go to PowerBI.com and login to your Power BI site (or sign up if you haven’t already).
image

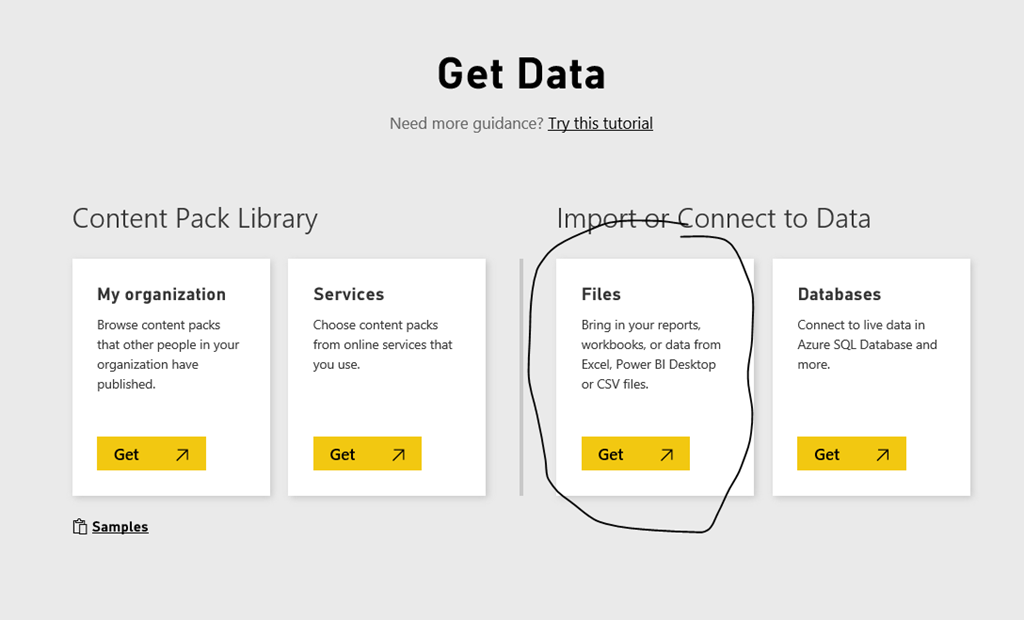
2. Once you’ve done that, go to Get Data, and then choose Files
image
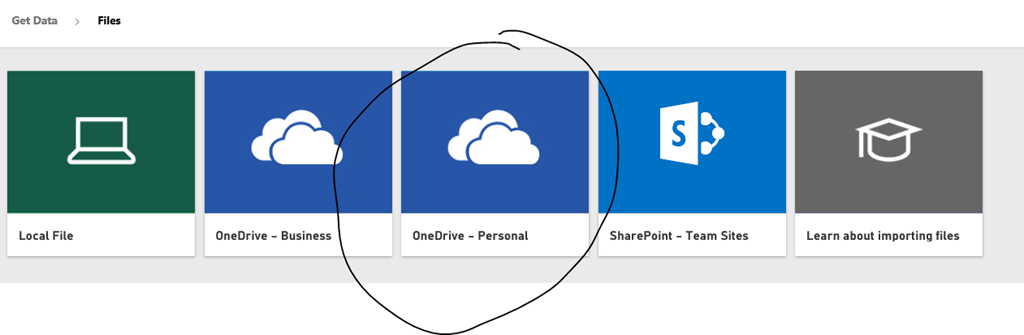
3. Choose OneDrive-Personal and select the survey you just created
image

And that’s it – you can now create your report to show the results as they come in from the survey.  Simply design it, name it and save it.

image

And now with the new Power BI public embedding, everyone can see the results that come into my report.  So fill out the survey here – http://1drv.ms/1SXqFt5

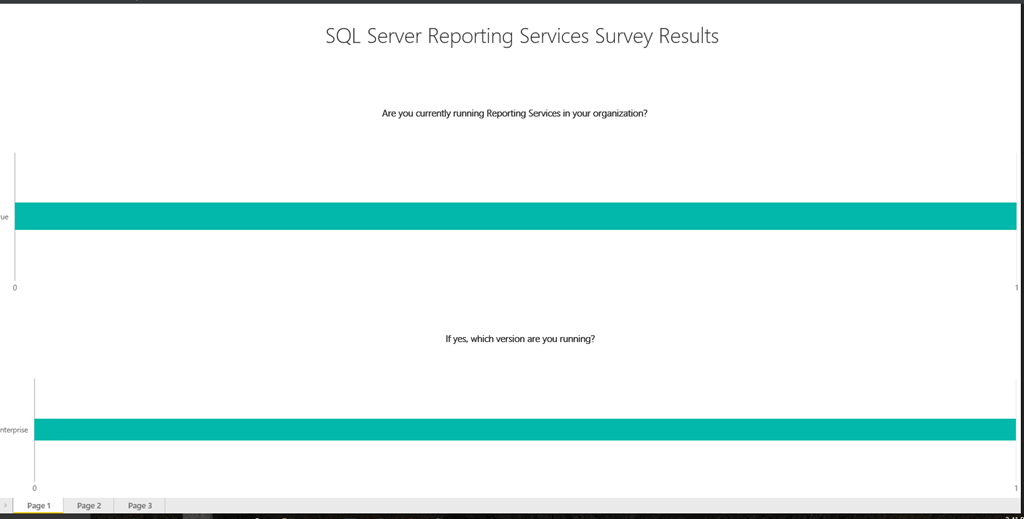
And view the results here – Survey Results

Thanks for reading, and I can finally tell Jen to quit bugging me to write this post.  Smile

Pin to Win – Use Power BI to get updated Reporting Services data in your PowerPoint presentation

image

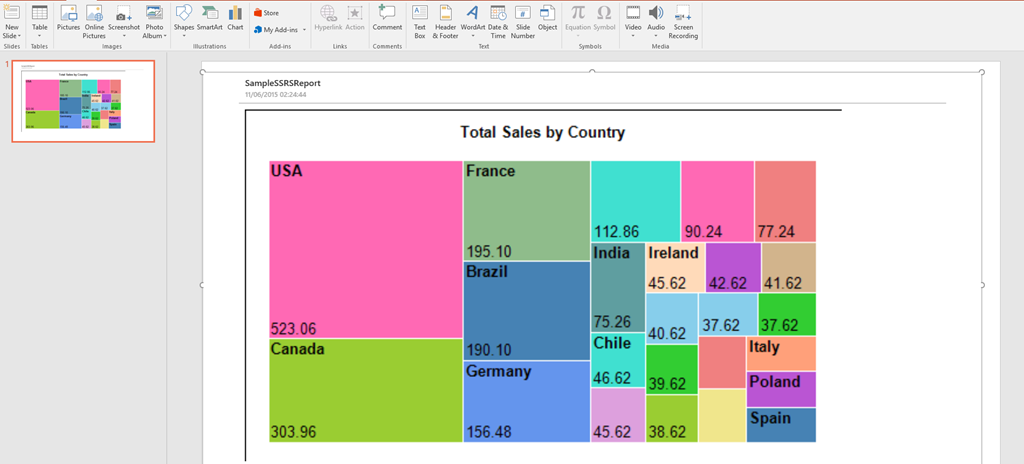
This was too cool not to blog about.  So the latest version of SQL Server Reporting Services supports Export to PowerPoint, but the data isn’t still live once it is exported.  Well, here’s a neat trick you can use to use elements from SSRS reports and have to data update in your PowerPoint presentations.  Use Power BI to make it happen!

1. Use the new pinning capability in Power BI to pin the report element from your Reporting Services report to your dashboard.

image

You’ll then see the SSRS element as a tile on your dashboard.

2. Use the new DevScope Power BI app in the PowerPoint presentation to add this element from your Power BI dashboard to your PowerPoint slide.  It’s an option just like every other tile in your Power BI dashboard to be selected and used.

firstpic

3.  The data gets refreshed hourly (the default option) in your Reporting Services report element in Power BI.  When the update happens, refresh the tile in PowerPoint and you’ll see the latest data and the time the data last refreshed!

image

This was an unexpected benefit of using the Power BI tiles in my PowerPoint presentation.  Heck, you could also do this in an Excel workbook!

Thanks for reading!

Game Change Two : Electric Boogaloo – Special PASS Edition of the Powerful Productivity Series

Fabrikam-Black

Game on.

That would have been the extent of the Microsoft Business Intelligence roadmap blog post if I’d written it (and is probably why I wasn’t picked to do so.)  But that was the takeaway that folks seemed to have after this week’s PASS Summit and after reading that post.  Chris Webb had a great write-up of the event where he said “In summary I can’t remember the last time I felt this positive about the future of Microsoft BI.”  Marco Russo tweeted on Wednesday “I’ve seen the most consistent, coherent, inspiring #msbi roadmap in 10 years.”

And the star of the show?  The Box.

No, not the movie from 2009 with Frank Langella and Cameron Diaz.  I’m talking about SQL Server 2016 and all the BI goodness that is coming with it.

The sessions given by Frank Weigel and Riccardo Muti were jammed with attendees (both had to stop people from coming in) who tweeted their excitement throughout with an almost religious fervor, especially when it came to SQL Server Reporting Services.  Think I’m exaggerating?  Look at this –

image

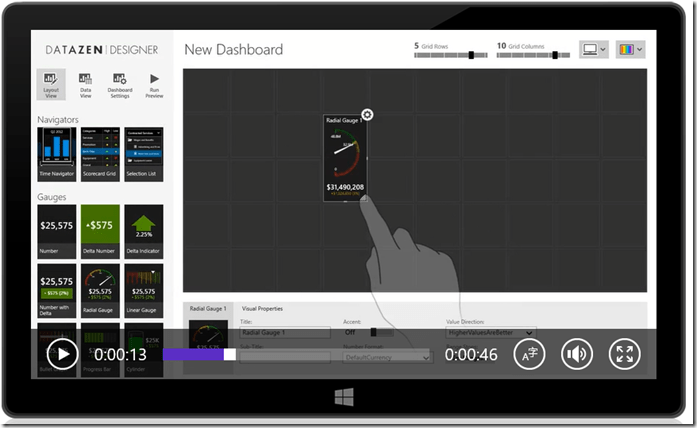
Sheesh – who knew the passion one would inspire by giving people the ability to re-position report parameters and export to PowerPoint.  Or maybe it was in response to the announcement that there will be support for Mobile Reports and KPI’s based on Datazen technology at GA in Reporting Services 2016

image
Boom goes the dynamite!

AND support for Power BI Desktop Reports in Reporting Services 2016 post GA

Boomshakalaka!

I could probably end the post right now with “Woohoo, we win!  We win!  Victory dance!  The box is back!”.  But if you remember my original Game Change post, as excited as we all are, are non-PASS attendees going to have this reaction?  I mean, I’m sure Telly Savalas would kill it every time saying “We’re all born bald, baby!” at the keynote of the annual meeting of the Bald Headed Men of America.

But how does that play when he goes on the road away from his fellow baldies?  Do the folks with hair get just as excited, or does someone stand up and say, “Wait a minute.  I thought you were dead?”  Which is exactly what I’m sure some customers will say when this is demoed to them for the first time.  Several jokes and tweets were even made during PASS about how SSRS finally looked like something built this century.

image
My dad loved his Ford Mustang as a kid!  Oh, now I get it . . .

This meant, however, sales folks and partners talking to customers about Microsoft BI generally avoided showing the product despite it having some incredibly powerful capabilities because “it looked like it fell out of an ugly tree and hit every branch on the way down”.  I actually had a customer say that about Reporting Services.  Or was it about me?  Either way, the meeting didn’t end well.

That meeting would have been much, much different now, for a number of reasons that I’ll call out two of –

1. Everyone loves Datazen.  Okay, I’m sure it’s not EVERYONE, and the product isn’t perfect.  But that’s the beauty of it being rolled into SSRS – where the product is missing certain features (lack of WinAD group support, etc.) is where Reporting Services is strongest.  And vice versa.  The interest in Datazen from Microsoft customers has been off the charts since they were acquired in April.  That’s due in no small part to the fact that the product demos incredibly well to the same people you’d never have dared showing Reporting Services to in the past, despite that functionality being something they were looking for (as I’ll demonstrate in the second point).

image
Hey, I can do that!

It makes perfect sense to bring these products together, and I’ll go into more details about what this all means for Datazen going forward in a separate post.

I’ll add one last thing, and this is the only time I will address this – if you heard the news that Datazen was being added into Reporting Services, and even for a moment had the word “ProClarity” pop into your head, STOP IT.  The difference between the two situations are so stark I can’t possibly cover off on all of them.  Even my pal AJ here at Microsoft, who came here in that acquisition ten years ago, laughed off the comparison.  But here’s two of the biggest differences:

Miljan Braticevic wasn’t here.
James Phillips wasn’t here.

Moving on.

2.  Let me tell you a true story  – one of my old customers brought in a solution from a competitor a couple years ago to replace another BI solution they had (NOT Microsoft’s).  This instance runs the majority of their reporting internally.  Their report looks like this –

image
Oh, I’m sorry.  I accidentally posted a picture of a paginated report in Reporting Services 2016, didn’t I?


Tricky, tricky

Yes, that’s because their report used functionality that could be done easily in Reporting Services using nothing more than Report Builder.  And their main method of distribution for these reports?

Subscription via e-mail.

And did I say one customer?  I meant to say MORE than one customer who had brought in our competitor’s product was using it solely to do reports like this!  I couldn’t believe it – all you heard was about how sexy and cool this other product was, yet the reports I saw people building with it were paginated reports often distributed via email!

So why were they meeting with me, you ask?  In essence, here’s what each of them said –

“Well, we’re a big Microsoft customer and we’ve run into some limitations with our current BI solution, so we were hoping to see if Microsoft had something that could provide them with a more holistic solution.  You know, something that would scale out to the entire organization, tie into our current security infrastructure, offered a great hybrid story that included both self-service and enterprise reporting options, plus mobile options for all device types and can easily surface the data in programs like Excel and PowerPoint.  Oh and it had to sit on-prem, because they weren’t ready to move everything to the cloud yet.  Did we have anything like that, either now or in the near future?

Your damn right we do.  Because the box is back.

Happy Halloween, everyone!