Happy Friday all!
Last week, we announced the latest preview of Power BI Report Server, which included new functionality like additional data source support and support for viewing Excel Workbooks. As you’re trying these new features out, I wanted to highlight some items you might find useful as you get started testing –
1. Keep in mind Office Online Server requires you be part of a domain when you set it up on a server, or else installation will fail. This is additional requirement beyond what Power BI Report Server requires on its own, where it can run on a server that isn’t domain-joined. Keep that in mind if your demo environment is your personal laptop.
2. If you’re setting up an environment for test/dev/demo purposes, you can install both Office Online Server and Power BI Report Server on the same machine if you’d like. This isn’t a supported scenario for production purposes, obviously, but might simplify the setup of your test/demo environment.
3. You can embed Excel Workbooks into other applications using the simple embed functionality at the end of your report URL – for example, I embedded the following live Excel workbook into a PowerPoint slide using the web viewer app from the Office Store, so I can interact with the report during presentations.

4. When installing the version of Power BI Desktop (August 2017) we shipped with the preview, it will normally upgrade the June 2017 version of Power BI Desktop for Report Server if you have that installed. For some people, they’d like to run it side-by-side with the GA version of desktop for PBI Report Server and not upgrade it. You can do that – just install the “x64” version if you are running the 32-bit version of desktop on your machine, or vice versa. This should leave you with both versions (in addition to the version for the service if you have that installed as well). Please note – this should only be done on machines you are using for testing or development purposes, as this isn’t an officially supported configuration.

5. If you have multiple versions of Power BI desktop installed, the behavior is designed to always default to the last version you installed when you double-click on a Power BI Desktop file to open it. If you’d like to use a different version of the desktop you have installed on your machine with a particular report, make sure you open that first, then open the file you’d like to work with.
6. Have you tried the comments feature yet? You can add comments to any report in Power BI Report Server (including Excel Workbooks) by clicking the comments icon on the right hand part of the screen and then add your comments, along with an attachment file if you’d like.

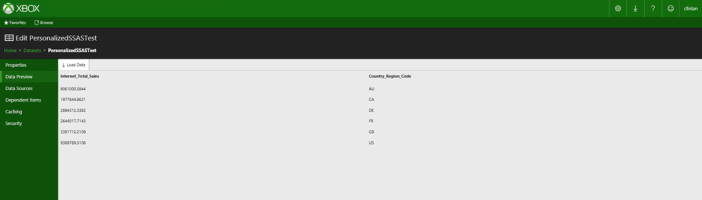
7. If you want to use a live Analysis Services connection with an Excel Workbook in Power BI Report Server, you’ll need to make sure the machine running PBI RS is an administrator on the Analysis Services instance for this to work, since we’re using EffectiveUserName in Office Online Server to make the connection. John White talks more about this in his blog for SharePoint 2016 and OOS setup as well.
8. If for some reason you need to access the more advanced settings for Power BI Report Server via SQL Server Management Studio, you’ll need to connect using the reportserver endpoint, like in the following example –

9. One item you can turn on via Management Studio in Power BI Report Server is the “My Reports” functionality. This is a simple way to enable access for your organization to a personalized area where users can store and author content in and have immediate access to the report server as long as they exist in Active Directory. It’s a little different than “Favorites”, where users can tag reports that they want to see in a single view. Definitely check out it if you haven’t already and see if it makes sense for you and your organizational needs.
10. Don’t forget to apply a brand package to your report server if you’d like to personalize it with your company/team/personal logo and colors!
With that, I’m happy to wish you a great Labor Day weekend (here in the USA, anyways), and thanks as always for reading!