Drillthrough from one Datazen Map Dashboard to another dynamically

Tonight’s post came out of a conversation I had with my friend Chris here at Microsoft (yes, we’re both Chris).  I was looking to see if I could drillthrough from a map of the United States into each individual state, and see the county-level information of another Datazen dashboard.  The answer is – yes, kindof!

Why the caveat?  Because I want to dynamically have the state change based on which one I select for drillthrough.  You can’t do that by drilling from one dashboard to another inside the Datazen app.  But you can do it by using the web viewer functionality in Datazen for your lower level dashboard.  Let me show you what I did.

First, in the Datazen Designer, I dragged a single Range Stop Heat Map onto the canvas and renamed it accordingly.
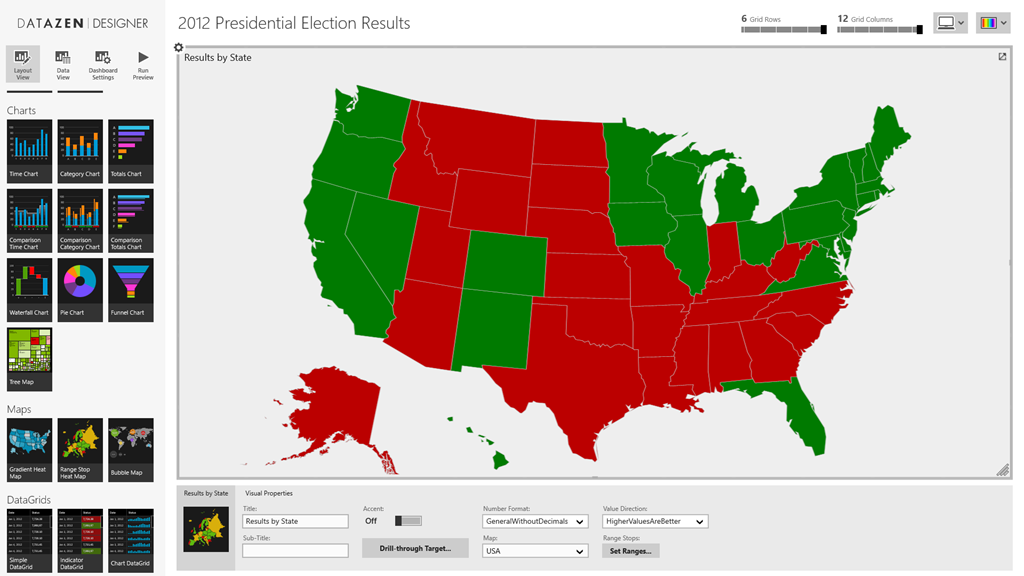
DatazenMap

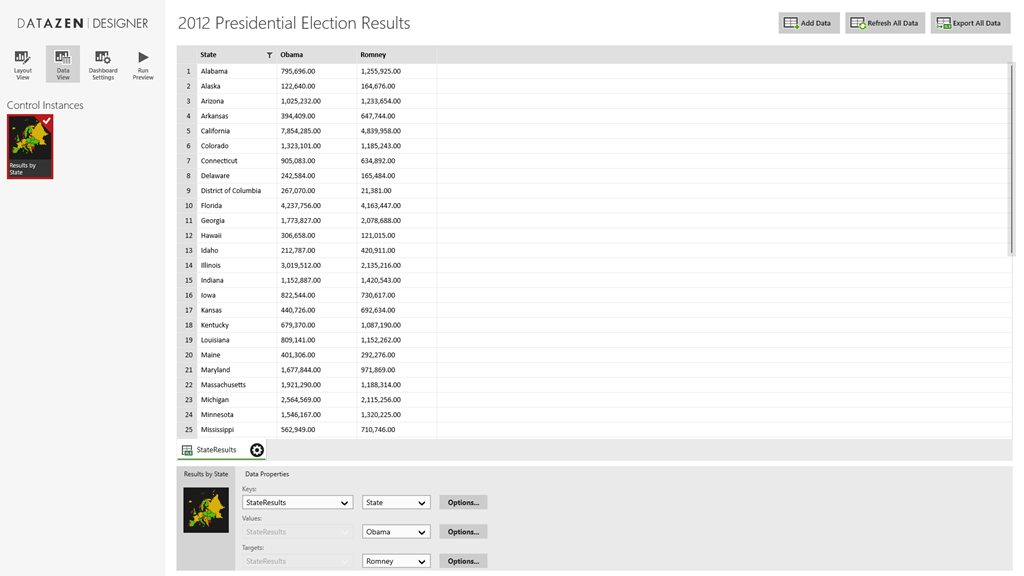
Next, I used Power Query in Excel to search online and find the state by state results for the 2012 Presidential Election.  I brought the results into an Excel file, and loaded the file into my Datazen dashboard under the “Data View” tab by choosing “Add Data” and “Local Excel File”.
Screenshot (27)
I made “Obama” the Values selection and “Romney” the Targets selection.  It doesn’t really matter which one you choose for which for this example, however.  Then I flipped back to my layout view.

I changed the range stop values to show a very narrow range for Neutral Start/Neutral End (99.98 and 99.99), so unless you had another Florida situation, you’d only see two colors for our map.  At this point, I saved it and created a new map dashboard.  But instead of using the out of the box maps, I loaded a new custom map from my local hard drive by choosing “Custom Map From File” from my map selection list.  Here I loaded the Pennsylvania map files I had (here they are if you would like to use them.  Just save them locally and extract them to somewhere on your machine – http://1drv.ms/1H1PtLp).

Screenshot (28)

Then I created a new map dashboard, doing all the same setup items I did for the map of the US.  I called it “Pennsylvania” and published it to my Datazen server.

I want everyone to see this dashboard, so I need to make it public, which is something that Datazen server supports.  To do that, I need to add a guest account to my Datazen server, and then give it rights to that dashboard.  So I add a guest Server User, like so –

image  Then I add Ol’ Guesty to my hub as a user –

image

Then I make sure I assign Sir Guest-A-Lot to my public dashboard (as you can tell, I’m kinda punchy right now).

image

Now I can link directly to this dashboard by using the following pattern as described in the Datazen documentation – http://local.server/viewer/public/dashboard?name=DashboardName. 

With that complete, I can go back to my original map dashboard and set up the drillthrough to the url of this state dashboard.  Since I want it to drillthrough to the selected state, and not just Pennsylvania, I’ll use the parameter value so my url looks like this –

http://sample.cloudapp.net/viewer/public/dashboard?name={{ RangeStopHeatMap3.SelectedItem }}

Now I publish my dashboard, and when I click on the state of Pennsylvania:
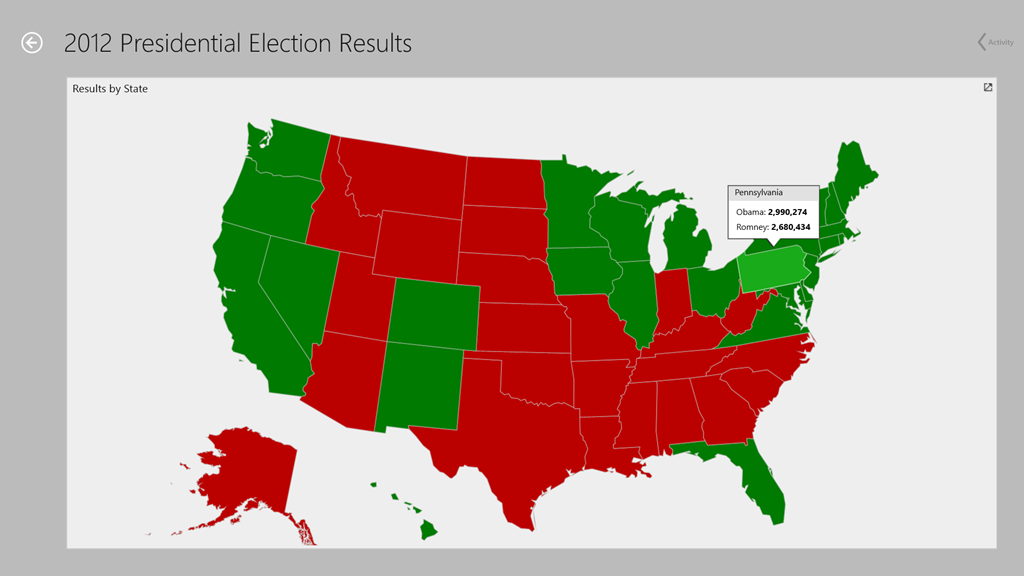
Screenshot (29)

A web browser opens up and I get this!
image

So yeah, there’s obviously the drawback I need to do this 50 times in this example.  But it DOES work (kindof), just like Chris and I discussed.

Thanks for reading!

How to drill-through from a Datazen dashboard to Power View in SharePoint

Welcome to the new blog home everyone!

So I’m assuming (perhaps incorrectly) most folks reading this know you can setup drill-through to a custom url in Datazen.  Usually, I talk to folks about it in the context of drilling through to a traditional SQL Server Reporting Services report, and I’m passing through some parameters I’ve selected on my Datazen dashboard.  But did you know you could also do something similar to a Power View report in SharePoint 2013?  Well you can!

First, you need to make sure you have Cumulative Update 4 for SQL Server 2012 SP1 applied in your SharePoint instance.  This update introduced the ability to use filters in a Power View URL.  The filters act as “pinned filters”, meaning they will apply to your entire report.  Assuming that is done, the process is fairly straightforward –

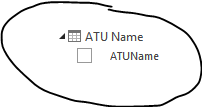
1.  You’ll need to create a Power View report in your SharePoint instance (you can get more information on that here).  You need to use the table name/field name of the parameter you want to pass-through as part of the url, so make sure you know both items.  For example, I used a field called ‘ATUName’ from a table called ‘ATU Name’ (quite clever, isn’t it?) for my example.

image

This translates to [ATU Name].[ATUName] when I’m creating my url.

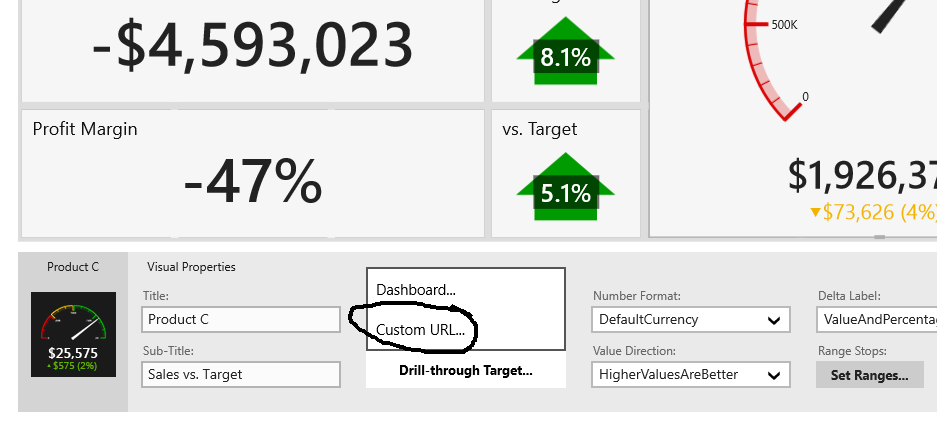
2.  Now that we have that setup, in the Datazen Publisher app, select an element that supports drill-through targets on the design surface. Open the Drill-through Target drop down in Visual Properties pane and select Custom URL, this will open the drill-through configuration dialog.

customurl

3.  Now I can enter my custom URL with the parameter I want to pass-through.  You have to make sure this typed out properly per the instructions in the blog post on using this functionality.  This includes the proper spacing and using the correct quote type properly.  See the example they give here –

image  

And then the end of my URL string –

urlcopy

Note that I included the space before and after ‘eq’.  You then also need to make sure you have quotes around the parameter you are passing through.

Now, you can’t test this working live in the development process.  You have to deploy the dashboard to the Datazen server, THEN you can test it.  An easy way to do that is from the web viewer.  If you login to your server in a web browser, you’ll see your dashboards listed like so –

image Select the dashboard you updated, and you’ll now see a little arrow on the widget you added the drill-through to Power View to.

image 

Make sure you’ve selected the value you setup as the parameter you’re passing through to the Power View report, then click the widget to jump to the Power View report.

image 

Your report will open with that parameter now pinned and applied to each part of the report!

image

This works from either the browser view of the Datazen dashboards, or from the Windows 8 apps, provided the web browser opens in desktop mode since the Power View report in SharePoint still renders in Silverlight.

Have a great weekend!

How to use an Excel data source for KPI’s in Datazen

Happy weekend, folks.  As mentioned in the guest post I did with Rob Collie, a folder of Excel files can be used as a data source for dashboards with Datazen.  However, when it comes to KPI’s, there isn’t out of the box support to use Excel as a data source for those.  But you can still use Excel if you setup a custom data connector to do so.  One caveat with this approach – what’s we’re basically doing is allowing Datazen Server to use Excel like it would a normal SQL Server data source.  This means you’ll need to write at least some basic T-SQL statements to actually bring back data from your Excel workbook.

Assuming you know how to do that, here are the steps you need to follow to enable this –

1. You need to download and install the Microsoft Access Database Engine 2010 Redistributable (choose the AccessDatabaseEngine_x64.exe option) on your Datazen server.

2. Create a new folder named OLEDB in the following location (this assumes you setup a custom data provider with my previous post.  If you haven’t, do that first.) –

C:\Program Files\Datazen Enterprise Server\service\dataproviderschemas

image

3. Download the following file – Excel.zip and extract the XML file to the folder you just created.

image

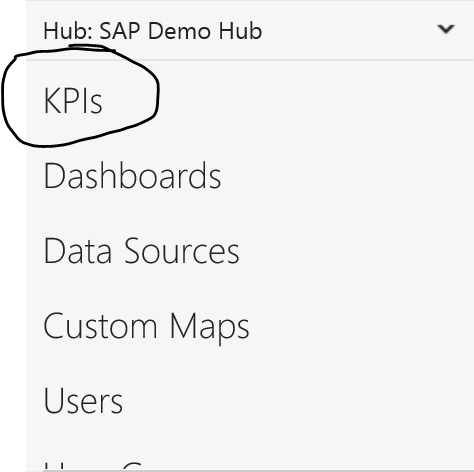
4.  Now login to your Datazen Control Panel and go to “KPIs” for the hub you want to setup with your KPIs.

image

5.  Click “Create New Group”

image

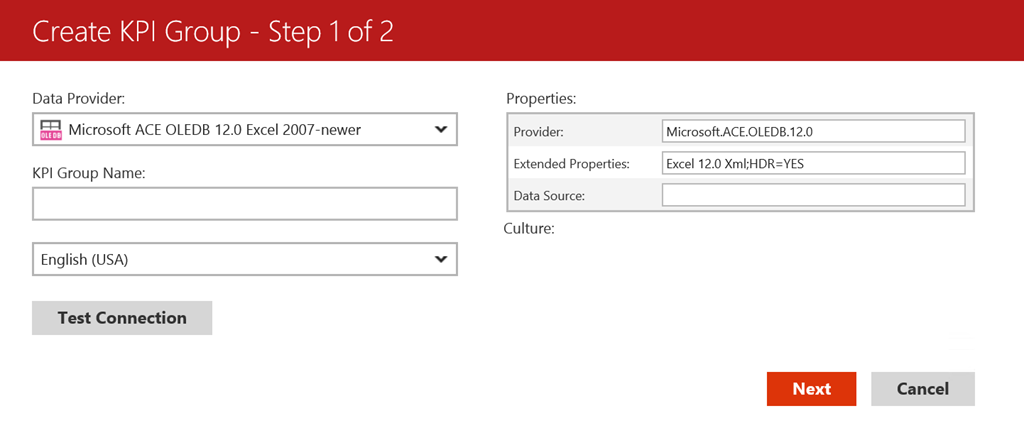
6.  You should see the new provider you setup in the previous steps listed as “Microsoft ACE OLEDB 12.0 Excel 2007-Newer” –

image

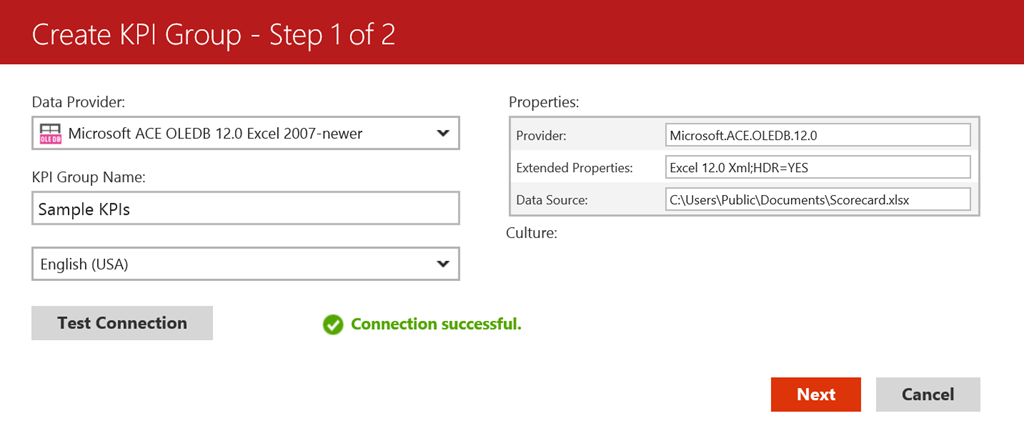
Enter a name for your KPI group, and leave the HDR=Yes item under Extended Properties if your Excel file contains a header row.  Otherwise, change it to “No”.

image

Next, in the data source area, put the file path of the Excel document you wish to you use.  Make sure it is some place the Datazen service account has access to.  Test the connection to make sure it works, and hit next if you see the “Connection Successful” message –

image

Select the groups who should have access to the data source, then hit Finish.  This will bring you back to the KPI menu with your new KPI hub showing –

image

If I click “Create New KPI”, I’m presented with the KPI Creation screen.  On the right hand side of the screen, I see my KPI Value/Goal/Status fields I can use my Excel data source for.

image

If I select the dropdown for “Value”, I can choose “Execute Query” and a “Define Query” link appears.  I need to click it to write my query –

image

Now I can write my query for this KPI Value.  The table name equates to the name of the tab in the Excel file, but you need to have a ‘$’ appended to it.  A sample query would look like this –

image

If successful, it should bring back a single result to be used with that KPI –

image

Hit ‘Update’ to save your query and return to the KPI setup screen.  You can now repeat the process for the Goal/Status/Trend Set items if you wish, or you may set any or all of those manually. 

If you want to learn more about KPI’s and how to set them up in Datazen, refer to the Datazen documentation.  Hope this was helpful, and enjoy the rest of your weekend!


How to build dashboards directly on your test/dev Datazen server

Greetings all!  After guest-posting on Rob Collie’s blog about Datazen earlier this week, I’m back on my own for this post.  One of the things that I love about Datazen is that you can use any Windows 8 device to build your dashboards on.  Simply go to the Windows 8 store, download the Datazen Publisher app, and you can be building beautiful dashboards within minutes.  Unfortunately, it appears not everyone is running Windows 8 in their organization (shocking, I know), so I wanted to show you a way to build dashboards directly on the Datazen server you spun up in my previous post, which is running Windows Server 2012.

When you use Windows Server 2012 machine, you have the ability to access the Windows App Store, just like you would from any Windows 8 machine.  However, you have to enable that, as it is turned off by default.  Here’s how you can turn that on –

First, go to the Server Manager and open it –

image

Then, you’ll want to enable a new feature.  So choose Add Roles and Features –

image

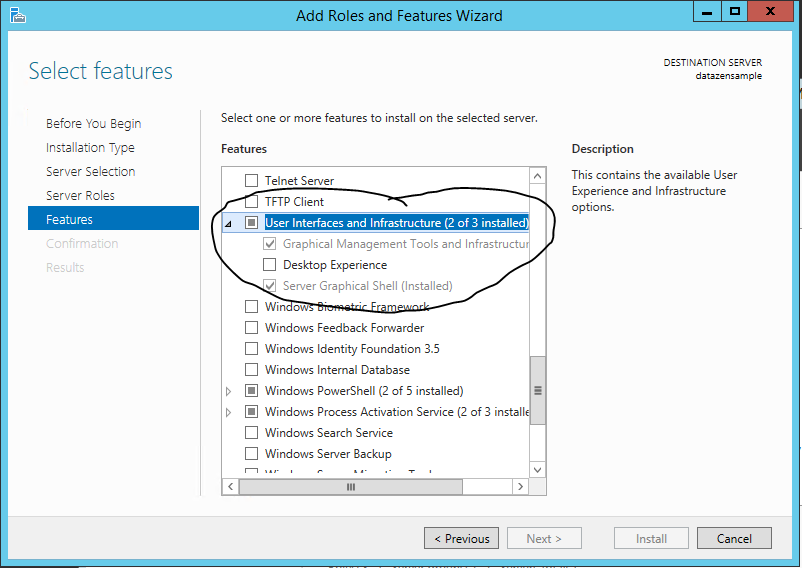
Click next until you get to the “Features” selection, then scroll down amongst the features and expand the “User Interfaces and Infrastructure” selection area. 

image

We can then enable the “Desktop Experience” by checking that box, clicking “Add Features” when the pop-up window comes up, and then choosing “Next”.

image

I’d suggest now checking the “Restart the destination server” checkbox and then hitting Install.  It has to restart anyways before that stuff is enabled, so you might as well do it now.  It’ll take about 15-20 minutes to install everything, and then the server will restart.

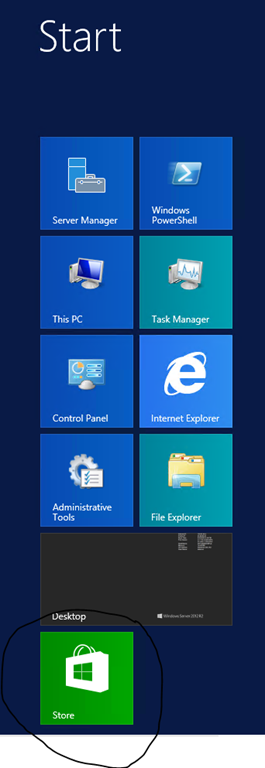
Once done, the Store App will appear. 

image

Here is where the first gotcha comes along.  You can’t use the built-in administrator account to use the Windows Store on the server, so you need to make sure you’re logged in with another account besides the one you setup when you setup the server.  That user can have server administrator privileges, however.  So great, you can open the Windows Store as this user.  Here is the next gotcha –

image

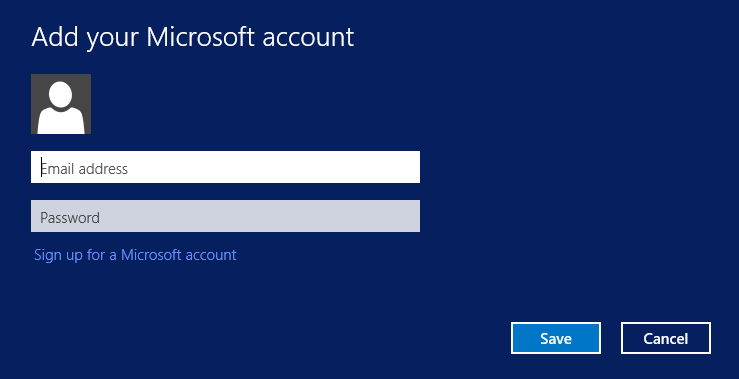
You need a Microsoft Account to download and install the apps – so you can either create a new account, or you can use one you already have setup and use for Xbox Live, for example.

Once that’s done, you can download the Datazen Publisher App and it will start installing

image

Once finished, it will show up in your list of apps –

image

Now, one last gotcha.  In order to get the publisher working on a Windows Server 2012 machine, you will need to create a Loopback Exemption for the Datazen App.  You can do this one of two ways –

Open an administrator command prompt, and then type this:

checknetisolation LoopbackExempt –a -n=componentart.datazenpublisher_4hjyx1gpectq6

or install this on your server and use the gui:
https://loopback.codeplex.com/

I prefer the latter, but it is up to you.  Once that is done, you can open the Datazen Publisher app and connect to your local server as the location you want to publish to.

image

Once connected, you should see any dashboards or KPI hubs that you’d previously created, and you’re ready to go.  You now have a one-stop shop for both dashboard creation and hosting!
Thanks for reading, and I’ll have more stuff later this week!
 

How to connect to Azure HDInsight from your Datazen server using ODBC

Happy Mother’s Day!

As with our previous post on connecting to SAP HANA, this is another easy one to knock out just by pulling together some previous posts from this blog and from Microsoft.

First, make sure you’ve followed the instructions in my post to setup your own Datazen server.

Second, make sure you follow my instructions to setup a custom ODBC provider on your Datazen server.

Third, spin up your own HDInsight cluster in Microsoft Azure.

Now, follow these instructions to install and configure the Microsoft Hive ODBC driver on your Datazen server, just like you did for your SAP HANA connection.

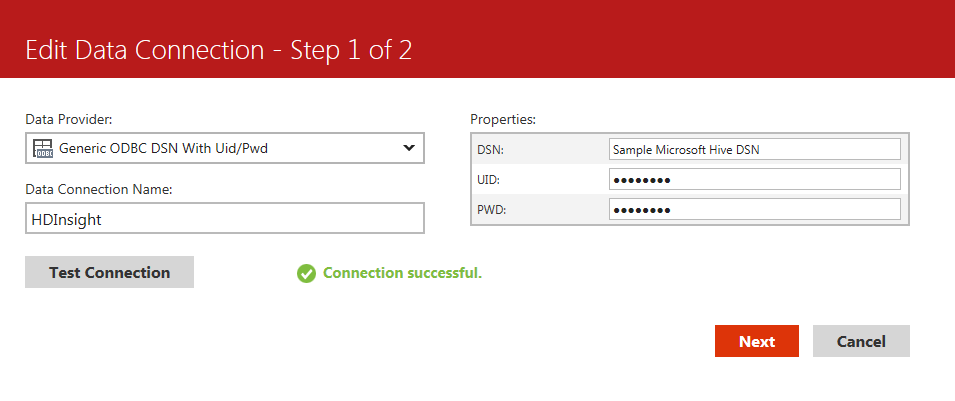
Once that’s done, you can follow the same steps you did to setup the other data source on the Datazen server admin portal –

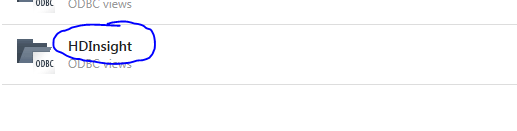
Under the BI hub you want to setup the HDInsight connection, select the Data Sources option.

image

Choose the custom ODBC provider you setup in my previous post so you can pass the username/password in the connection string to the HDInsight cluster.

image

Test the connection – you should get a success message if you connected properly.

image

Great – you’ve finished setting up your connection to HDInsight.  Now you can write a sample query against it and make sure it brings back data.  Click on the name of your data connection to go to the Data View screen

image

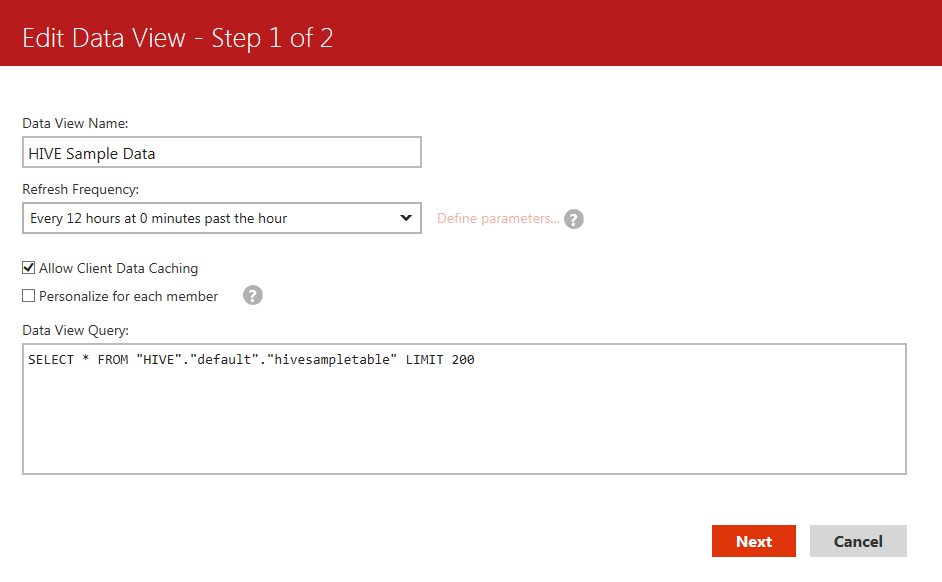
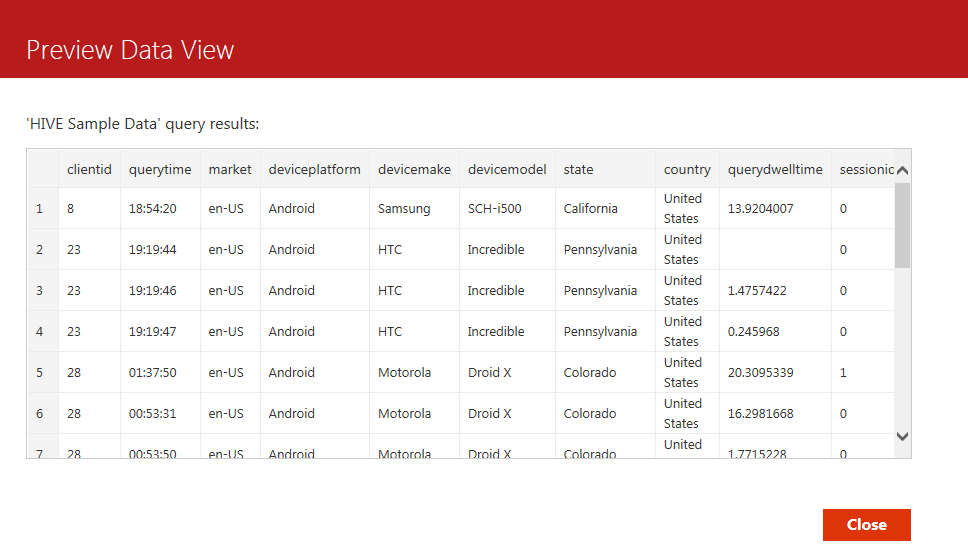
Now click the “New Data View” button to create a new view of your Hive data.  Give it a name, leave the “Allow Client Data Caching” box checked if you want to make sure folks can use the dashboards while offline, and choose a refresh frequency.  Then write your query to be used against HDInsight and hit Next –

image

Success!  I wrote my query properly, and now have this data view available for the dashboards I want to build in my Datazen Publisher App.

image

Thanks to the custom ODBC provider, adding new data sources from many different data sources becomes child’s play.

One final note – There’s a great blog post on how to setup ADFS for Datazen you can read here.  It’s really well done, and I highly recommend taking the time to step through it.

Thanks!


How to connect your Datazen server to SAP HANA via ODBC

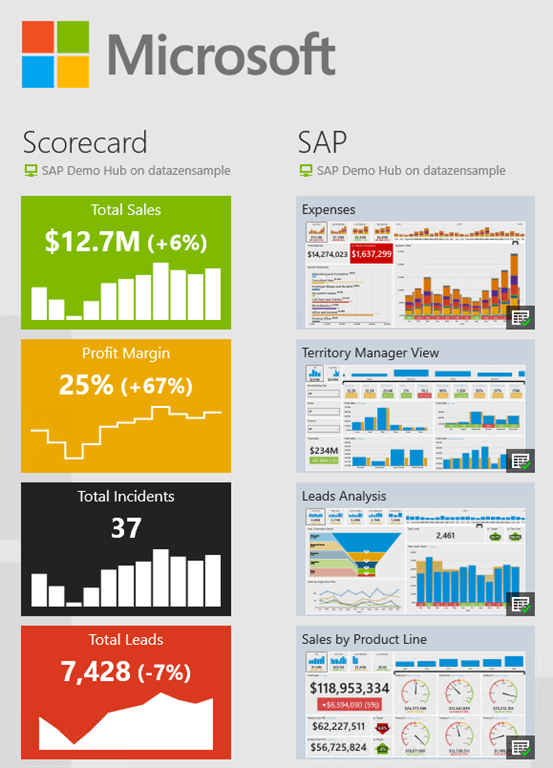
SAP

This is actually a pretty easy post for me to write, since I’ve done all the heavy lifting in three earlier posts.  So, things you’ll need to do as pre-requisites for this article –

Setup your HANA instance – follow the instructions in this post to provision a test/dev HANA server and deploy it to Azure if you don’t have one already setup. 

Setup your Datazen server – follow the instructions in this post if you need to set one up – http://bit.ly/1GtIuJ4.

Create a custom ODBC data connection file and add it to your Datazen server – follow the instructions in this post –  http://bit.ly/1AyJbw6

Once you’ve done those things, you’re already 90% of the way there.  Here’s what is remaining –

First, One thing I found when going through this was SAP seems to have made their native ODBC driver unavailable outside of the SAP software corner.  If you don’t have access to it, you can download one from Progress DataDirect to preview for free for 60 days.  It’s available for download at this link – http://bit.ly/1EaBsGc, and I used that for this post since that is one everyone can get at currently.

Make sure you download the 64-bit version and install it on the Datazen server.  Once you’ve installed it, you can create the system DSN file for Datazen to use.  The following steps you all do on the Datazen server.

Go to Control Panel – > Administrative Tools

image

Then choose ODBC Data Sources (64 bit)

image

Click the System DSN tab then click “Add”

image

Select the SAP HANA driver and click Finish

image

Enter a name for your data source, the description, and the host name.  If you followed the instructions in the earlier blogpost, you should be able to use the public IP address that your SAP HANA server was assigned for the host name.  Leave the port as is –

image

Hit the “Test Connect” button at the bottom and enter the credentials to connect to the server.  Assuming it authenticates, you should get a message showing it connected.

image

You can then hit OK to save your system DSN connection.  Now go to your Datazen control panel to setup the HANA connection and write your first query.

Under the BI hub you want to setup the HANA connection, select the Data Sources option.

image

Choose the custom ODBC provider you setup in my previous post so you can pass the username/password in the connection string to the HANA server.

image

Test the connection – you should get a success message if you connected properly.

image

Great – you’ve finished setting up your connection to the HANA server.  Now you can write a sample query against it and make sure it brings back data.  Click on the name of your data connection to go to the Data View screen

image

Now click the “New Data View” button to create a new view of your HANA data.  Give it a name, leave the “Allow Client Data Caching” box checked if you want to make sure folks can use the dashboards while offline, and choose a refresh frequency.  Then write your query to be used against HANA and hit Next –

image

Success!  I wrote my query properly, and now have this data view available for the dashboards I want to build in my Datazen Publisher App.

image

Congratulations – you’ve finished setting up SAP HANA as one of the data sources for your jaw-dropping Datazen KPI’s and dashboards!